Product · By use case
Measure injury and change the same way in every animal.
Necrosis, inflammation, liver zones and cell size, measured on every slide of a study. Each finding is outlined so a pathologist can check it.
A real run · H&E, rat liver
Zones and injury in rat liver, on plain H&E.
Liver zones
Rat liver after 28 days of phenobarbital. Fewer nuclei per mm² near central veins (906 against 1,352), where cells are enlarged.
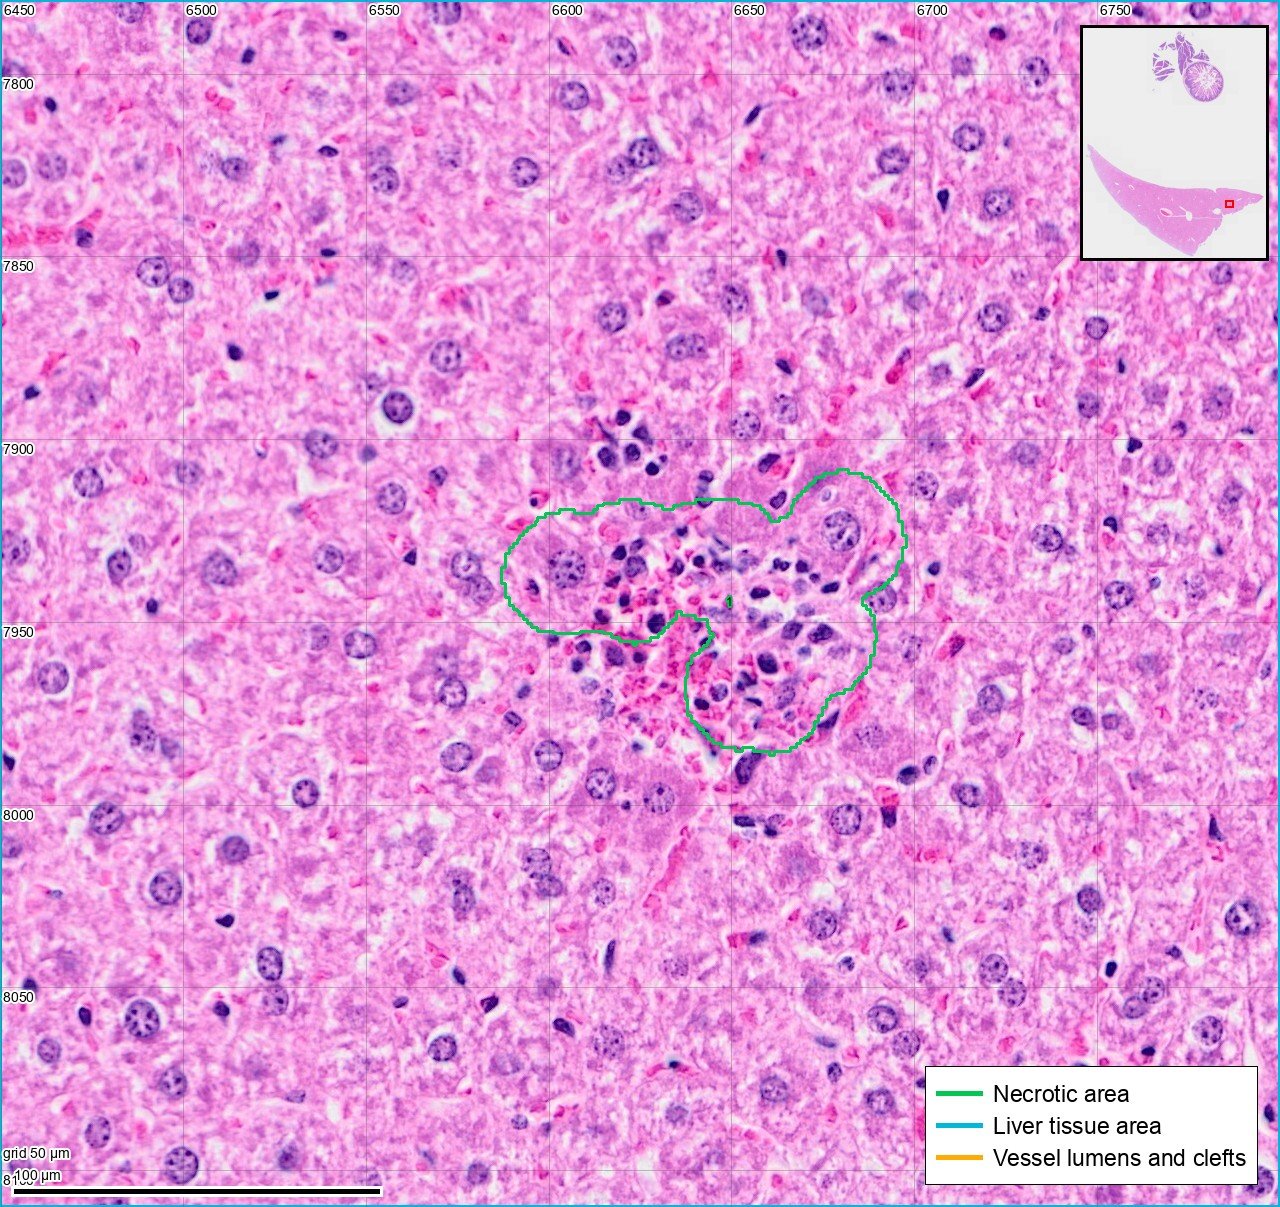
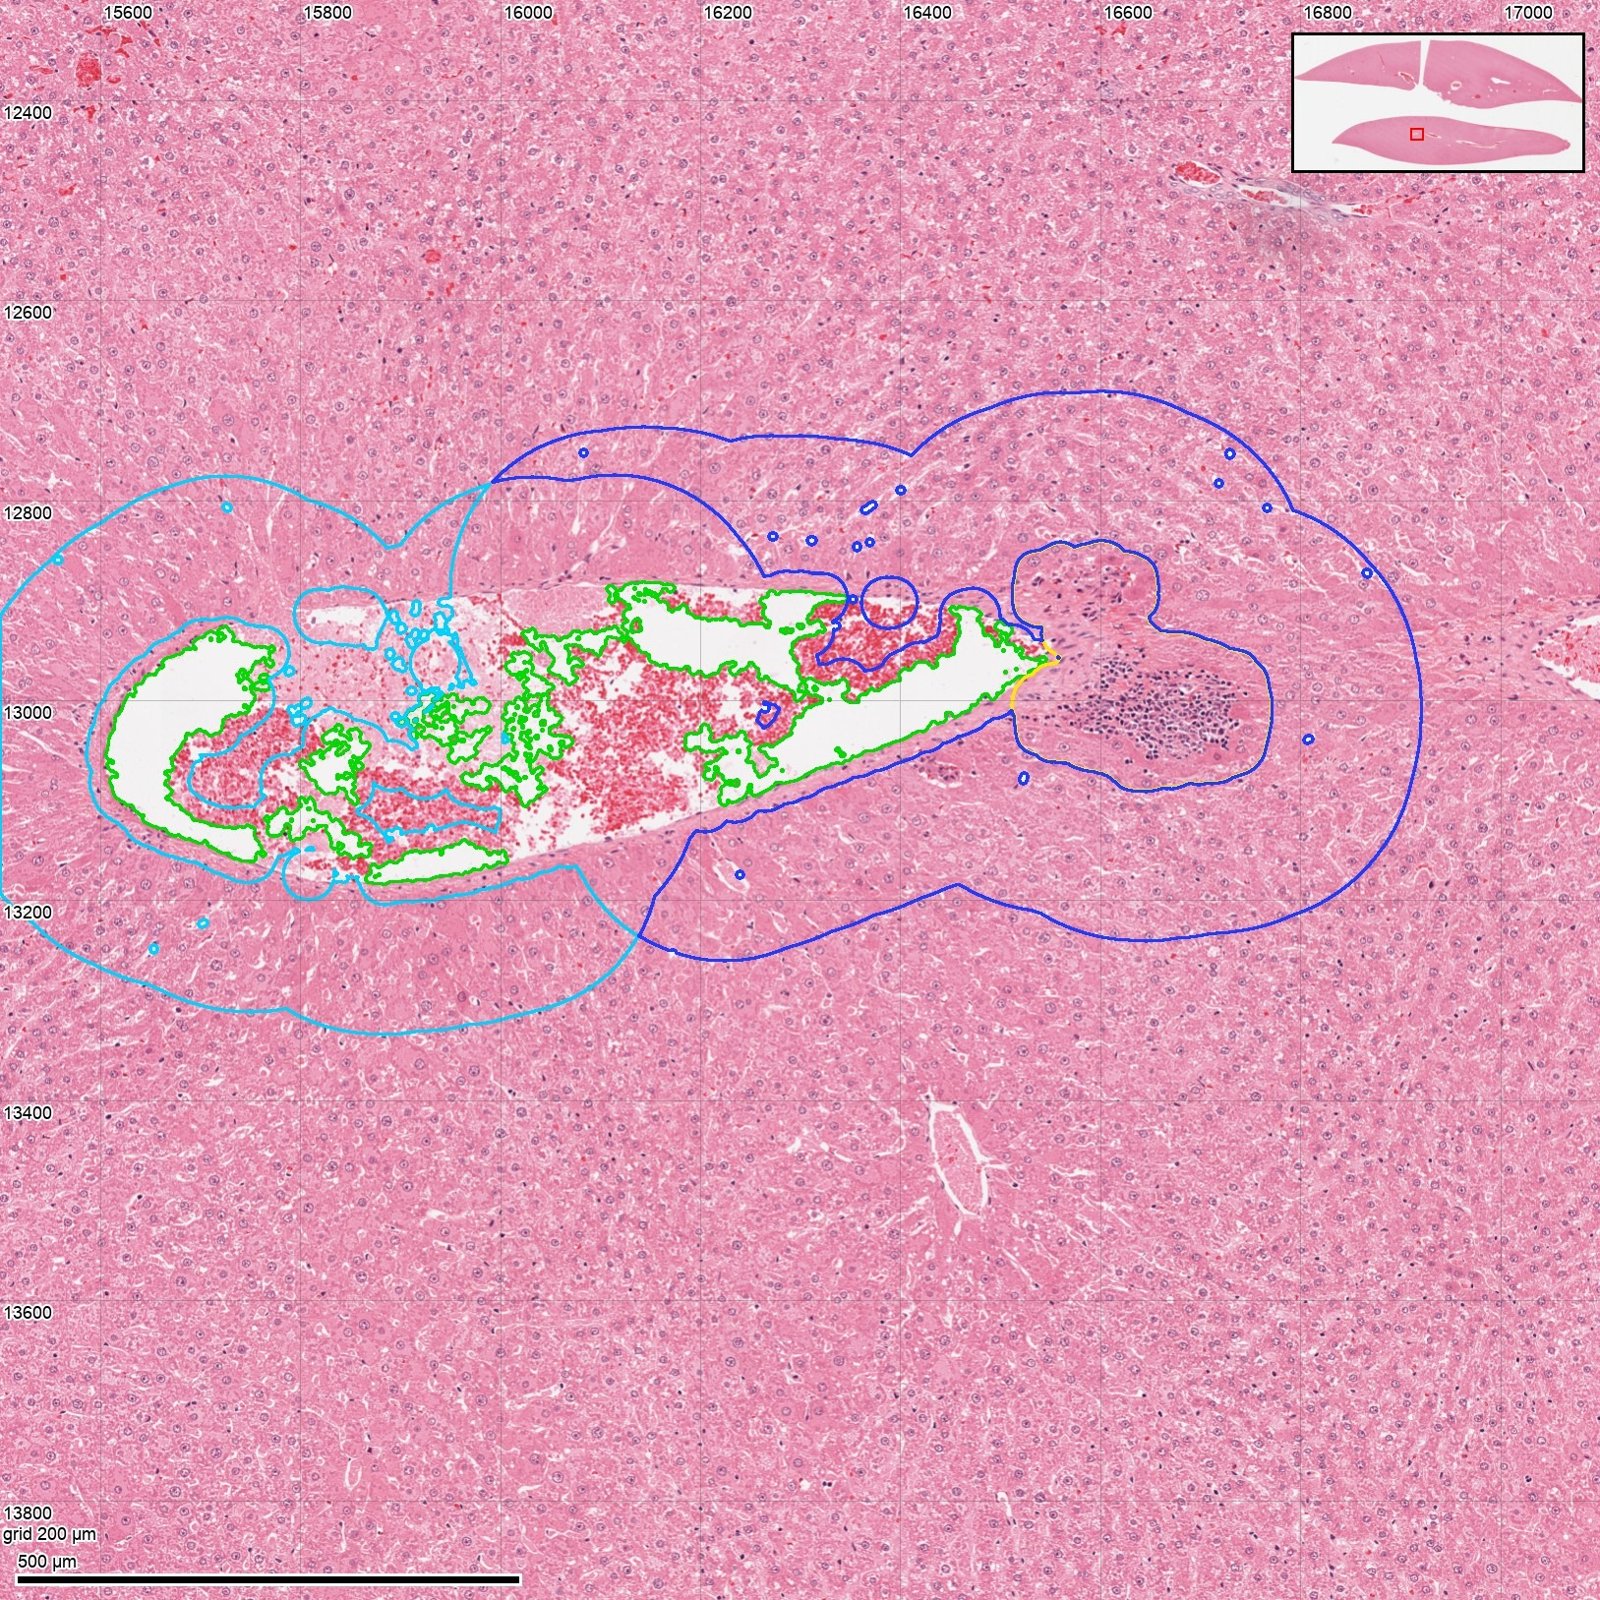
Injury
Foci of necrosis and inflammation found, outlined and measured as a percent of the liver.
What it flagged for a person to check
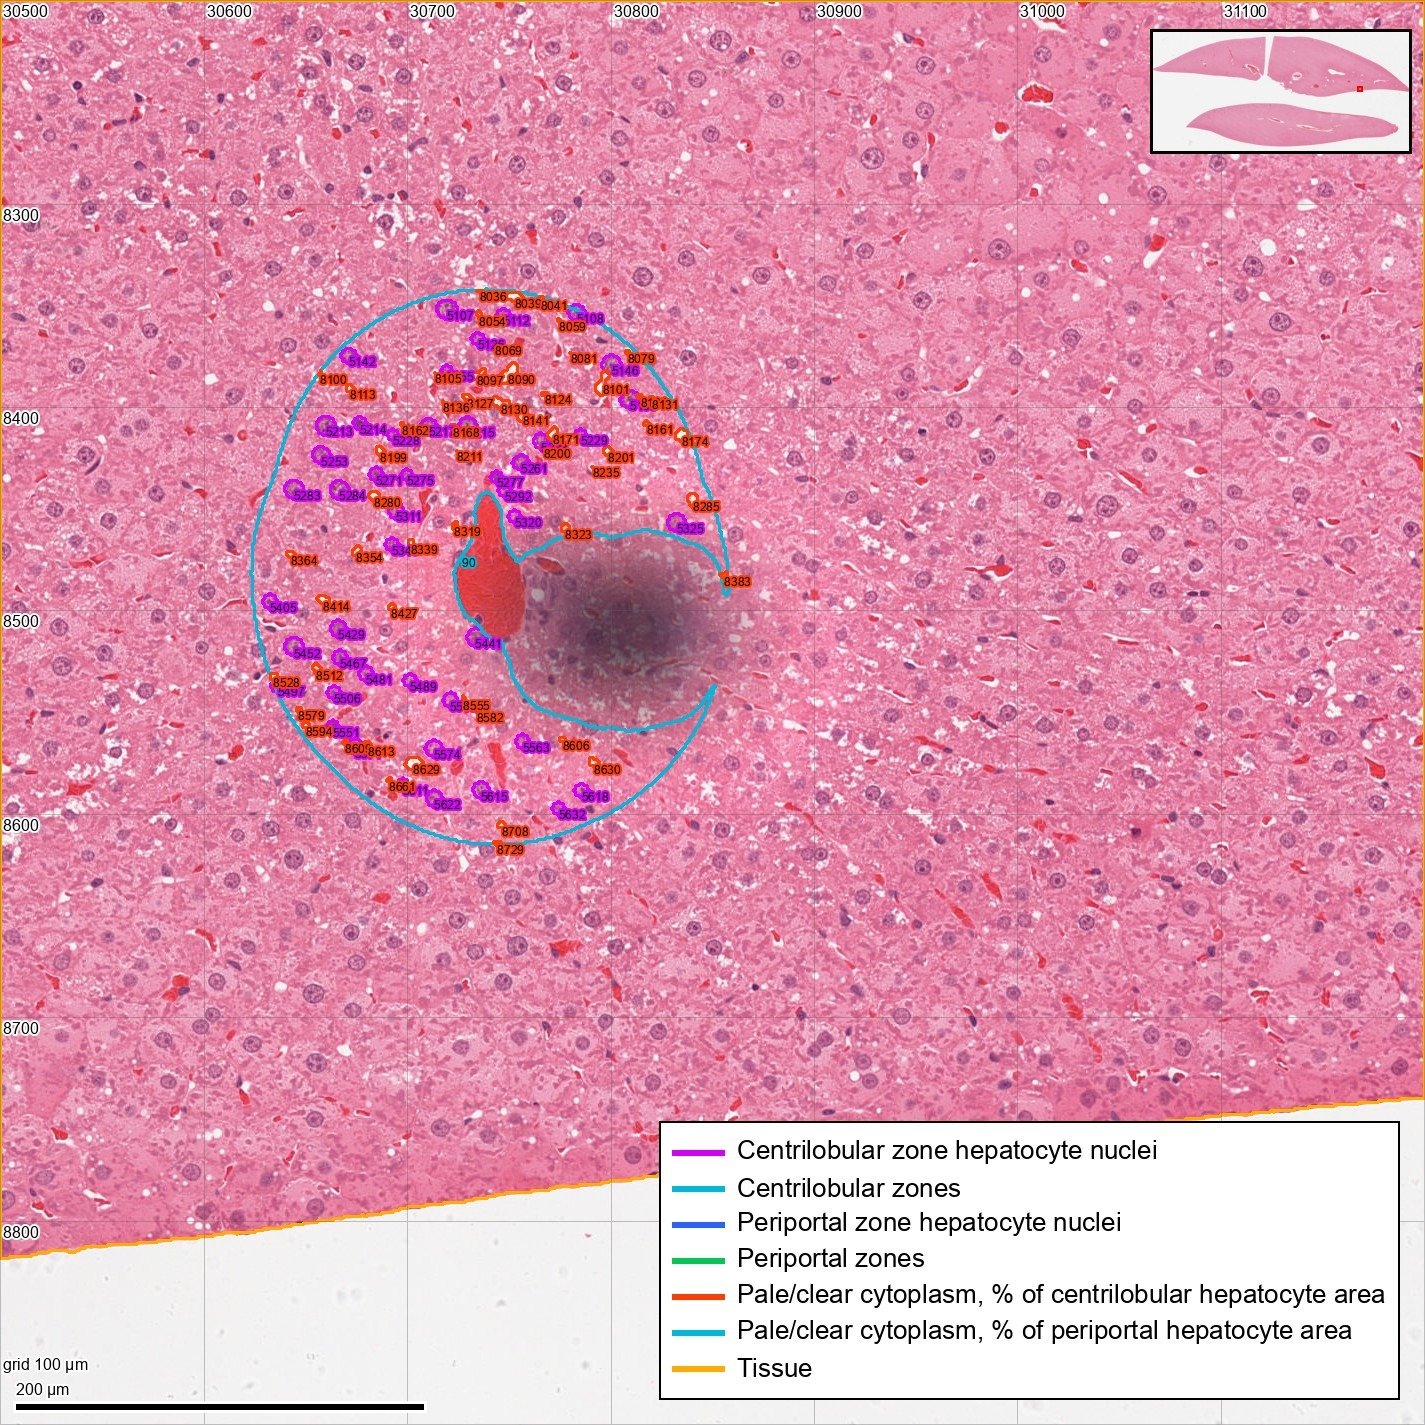
A smudge that is not nuclei
Out-of-focus grey blobs stain dark like nuclei. They were found and cut out of the liver zones.
Slides: Open TG-GATEs; Hautier et al., 2024.
What you can ask for
Ask for these, or anything else you can see.
In plain words. If it can be seen on the sample, the AI can build a method to measure it.
- Necrosis and inflammation, as a percent of the tissue
- Nuclei per mm² in each liver zone
- Fat droplet area
- Heart muscle cell size
- Collagen area, for fibrosis
How it works
You upload, and we run the study.
01
Upload your slides or flow files
Any stain or panel. One sample is enough to start.
02
Say what to measure
In plain words, the way you would ask a colleague.
03
We run the study
The AI builds the method on one sample. A person checks it and locks it, and code measures every sample with it.
04
Get the report
Numbers, outlines, gates and flags for every sample. You pay for each slide or flow file.
Why VSQRD
- Every reported number measured by code, never by eye
- First-hand research and wet-lab perspective
- Direct founder involvement from discovery to rollout
Start with one study you have already reported.
Upload its samples and tell us what you measured. We run it and show you where our numbers and yours differ.
Book a Discovery Session