Product · By sample
Count positive cells and measure positive area, for any marker.
Positive area, positive cells with an H-score, or counts inside one region of the tissue.
A real run · IHC, α-SMA
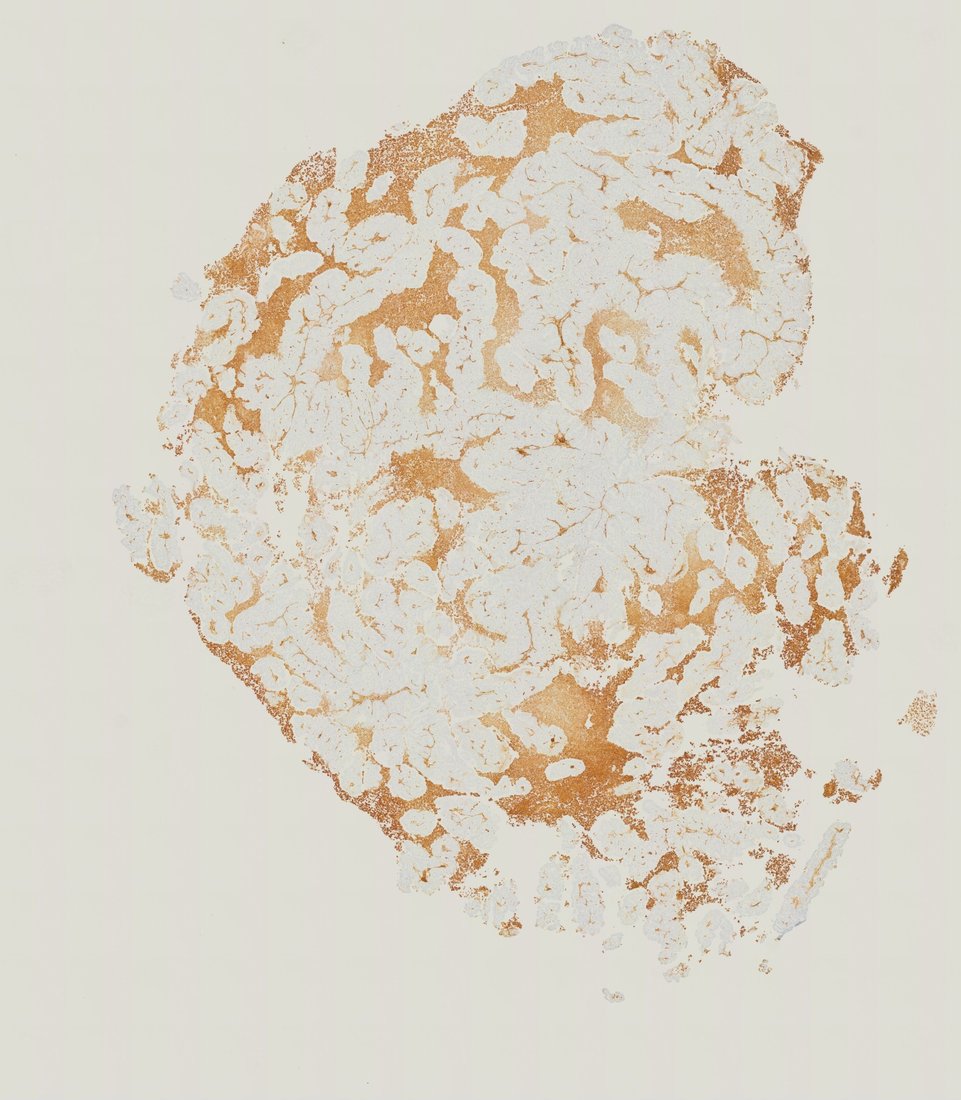
α-SMA positive area in a mouse tumour, on the whole section.
The request
“percent of tissue area that is SMA-positive (brown DAB).”
What came back, in 4 minutes
- 30.9%
- of the tissue is SMA-positive: 9.5 mm² of 30.9 mm².
- 26.8%
- is what the study's authors measured on the same slide in QuPath.
- 34.2% and 28.8%
- at a lower and a higher DAB cut, both given in the report.
What it flagged for a person to check
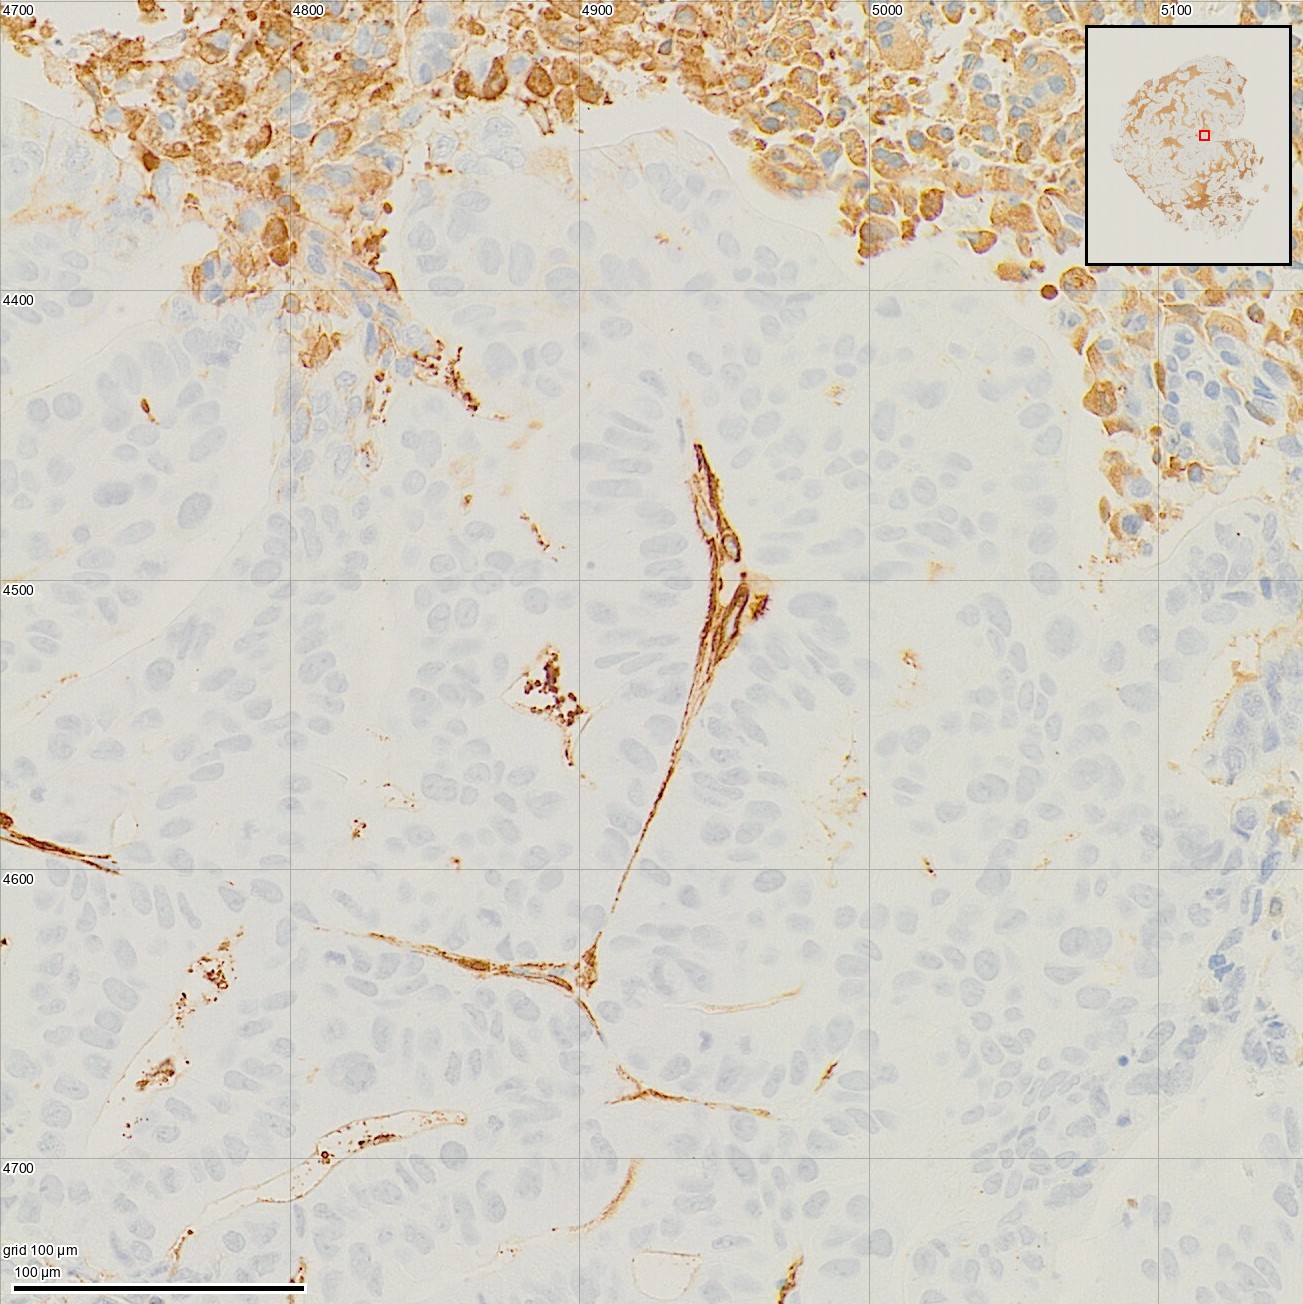
Review weak brown staining threshold
Pale brown strands sit beside strong brown cells. The report shows how the result moves with the cut.
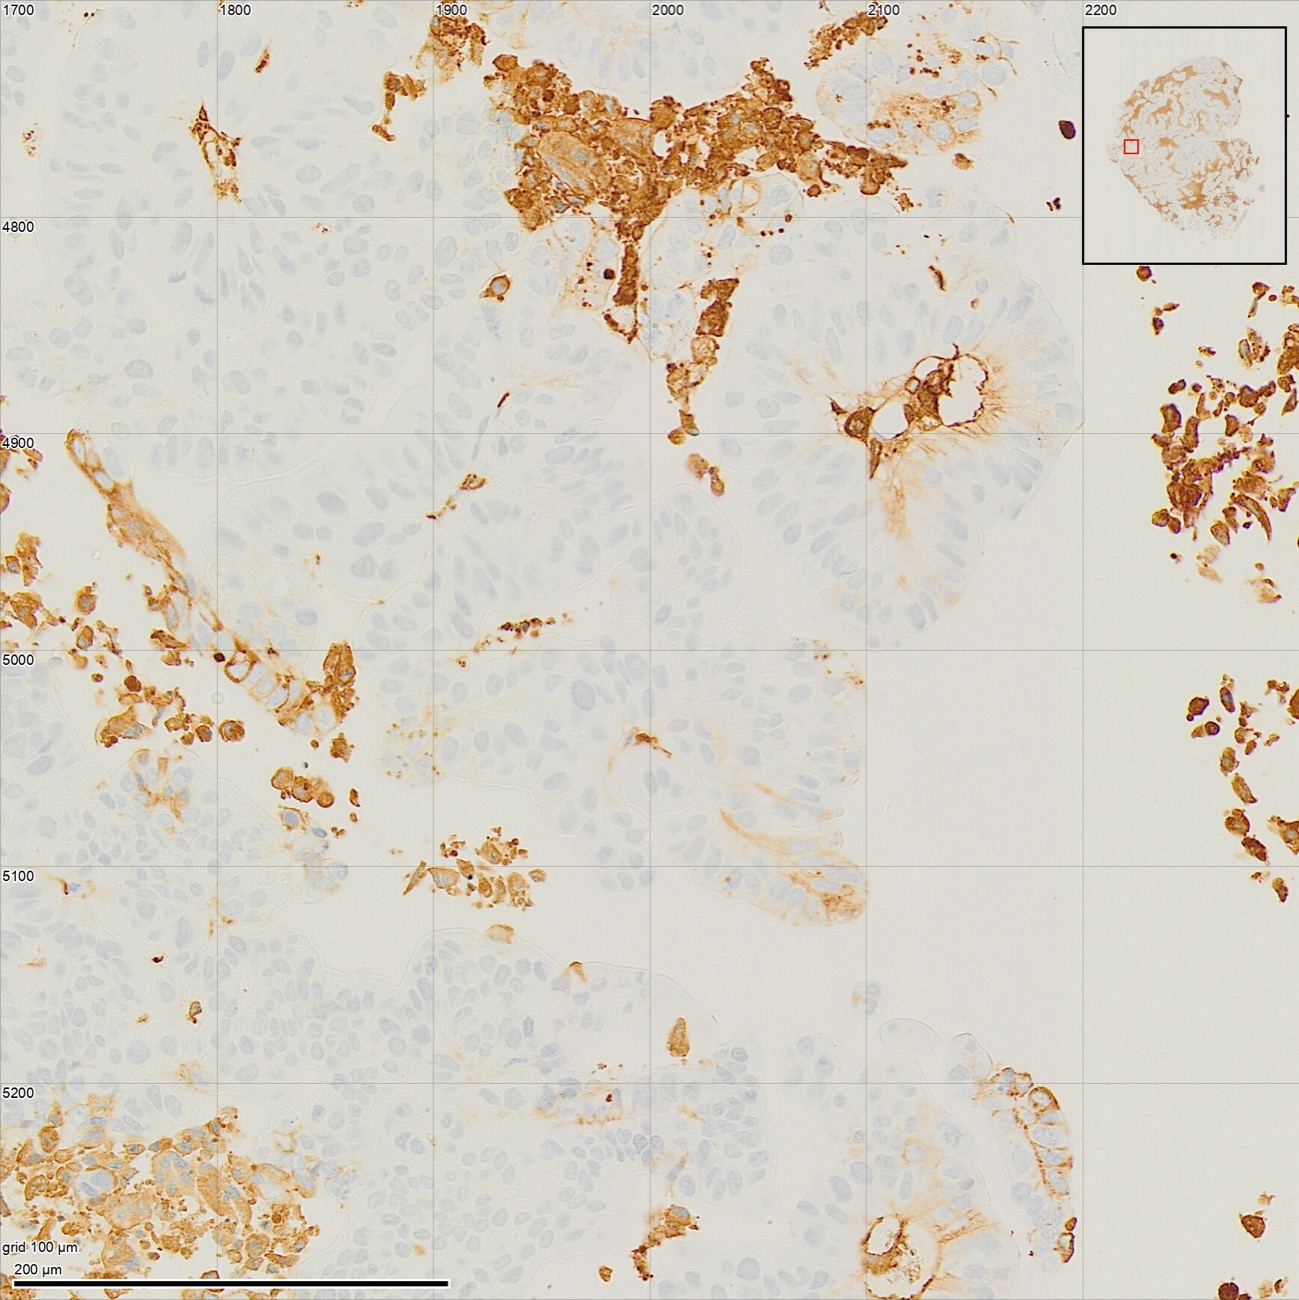
Review tissue boundary at fragmented margins
Loose stained cells and small gaps at the edge. The report says which were counted as tissue.
Mouse tumour, α-SMA IHC. Slide: Hayden et al., Zenodo 2021, CC BY 4.0.
What you can ask for
Ask for these, or anything else you can see.
In plain words. If it can be seen on the sample, the AI can build a method to measure it.
- Positive area, for any marker
- Positive cells, with an H-score
- A measurement inside one region of the tissue
- Double stains
- RNA dots per cell, on ISH
- Vessel density
How it works
You upload, and we run the study.
01
Upload your slides or flow files
Any stain or panel. One sample is enough to start.
02
Say what to measure
In plain words, the way you would ask a colleague.
03
We run the study
The AI builds the method on one sample. A person checks it and locks it, and code measures every sample with it.
04
Get the report
Numbers, outlines, gates and flags for every sample. You pay for each slide or flow file.
Why VSQRD
- Every reported number measured by code, never by eye
- First-hand research and wet-lab perspective
- Direct founder involvement from discovery to rollout
Start with one study you have already reported.
Upload its samples and tell us what you measured. We run it and show you where our numbers and yours differ.
Book a Discovery Session