Product · By use case
Count the immune cells your study is about.
CAR+ T cells, exhaustion markers and memory subsets from flow and mass cytometry, and immune cells named in place on multiplex slides.
A real run · CODEX, 58 markers
Every cell found and typed, on one section of human small bowel.
This is the workspace from a real run. The AI found 50,264 cells and named 40,168 of them, in 23 types. It left out the rest and says why. Turn the cell types and markers on and off.
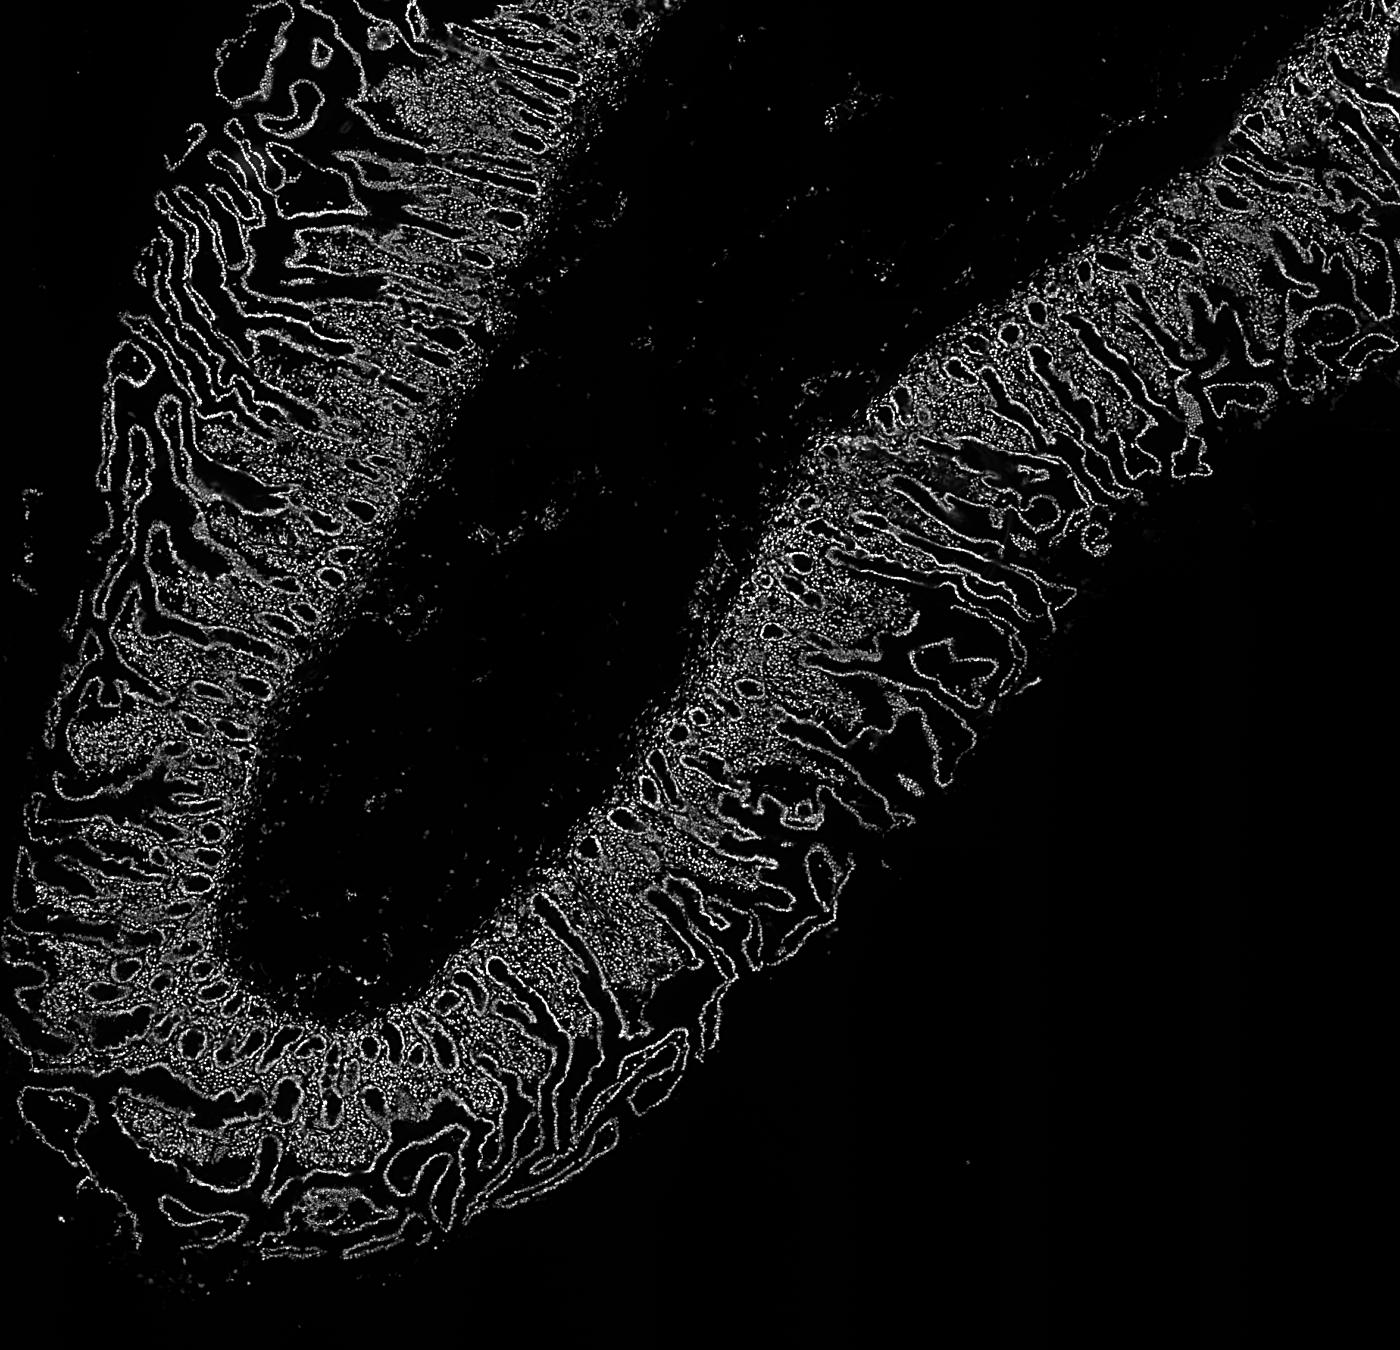
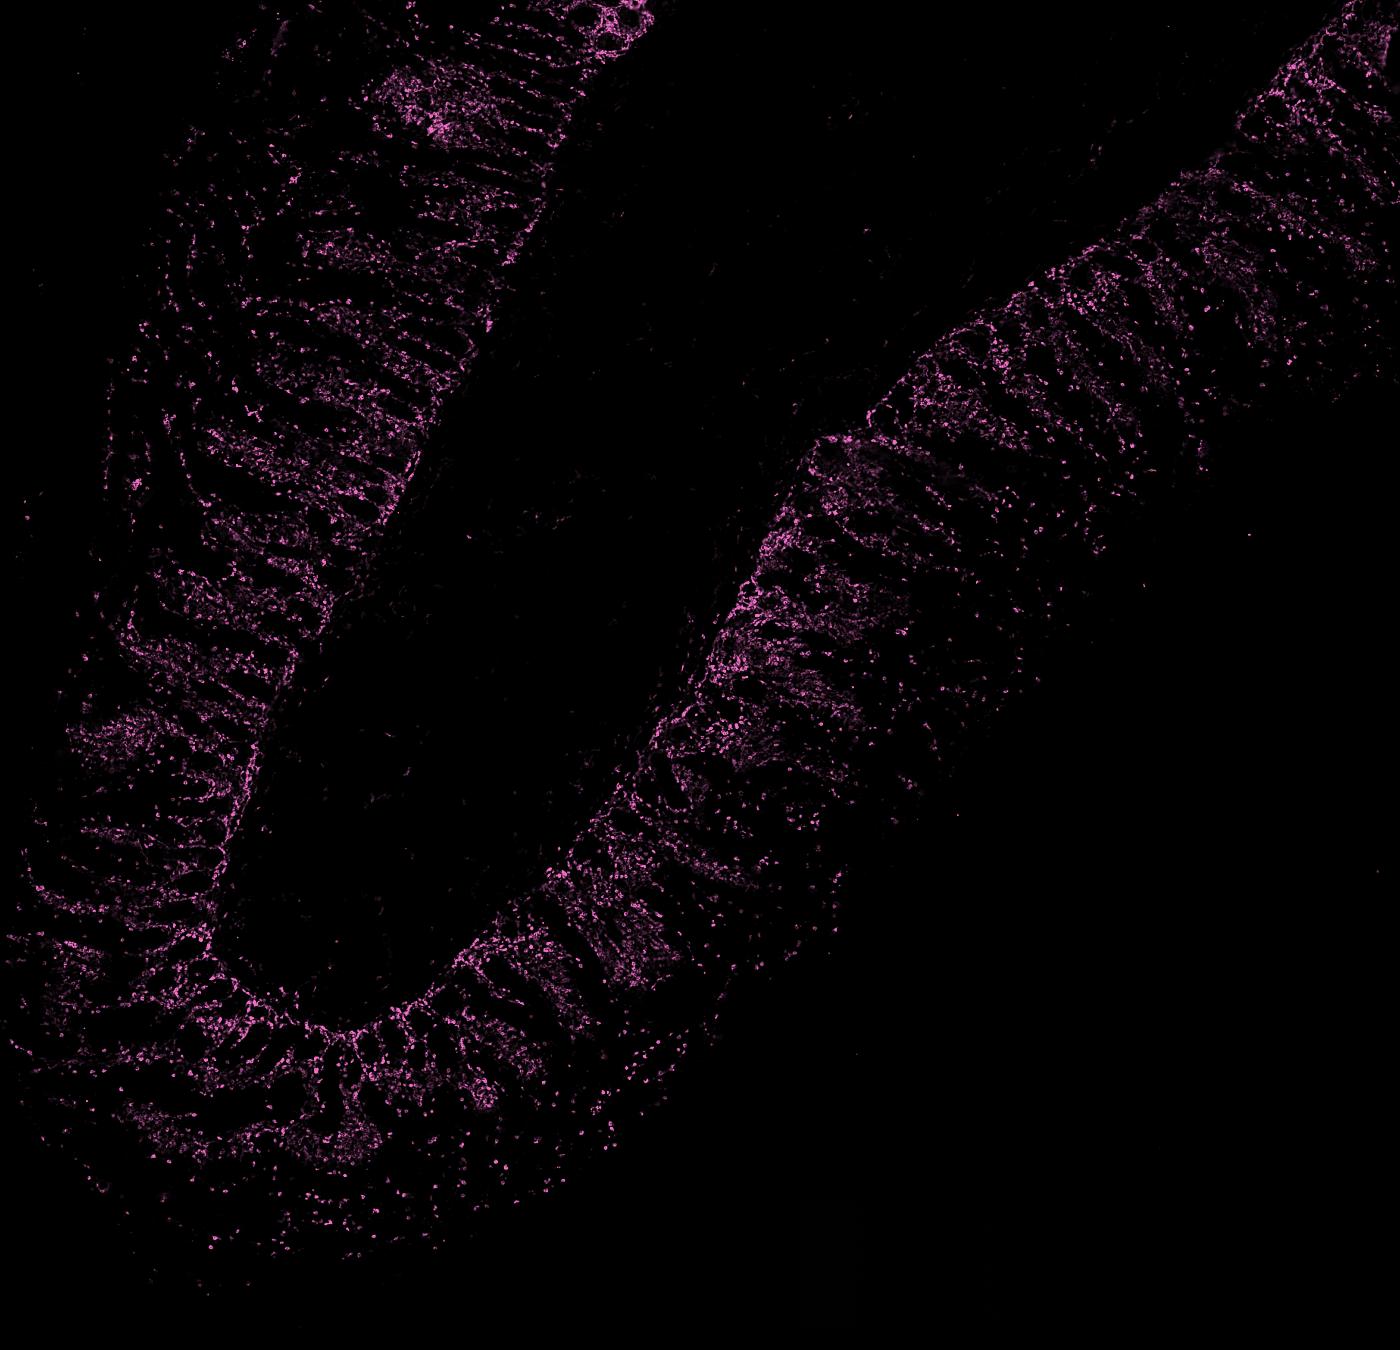
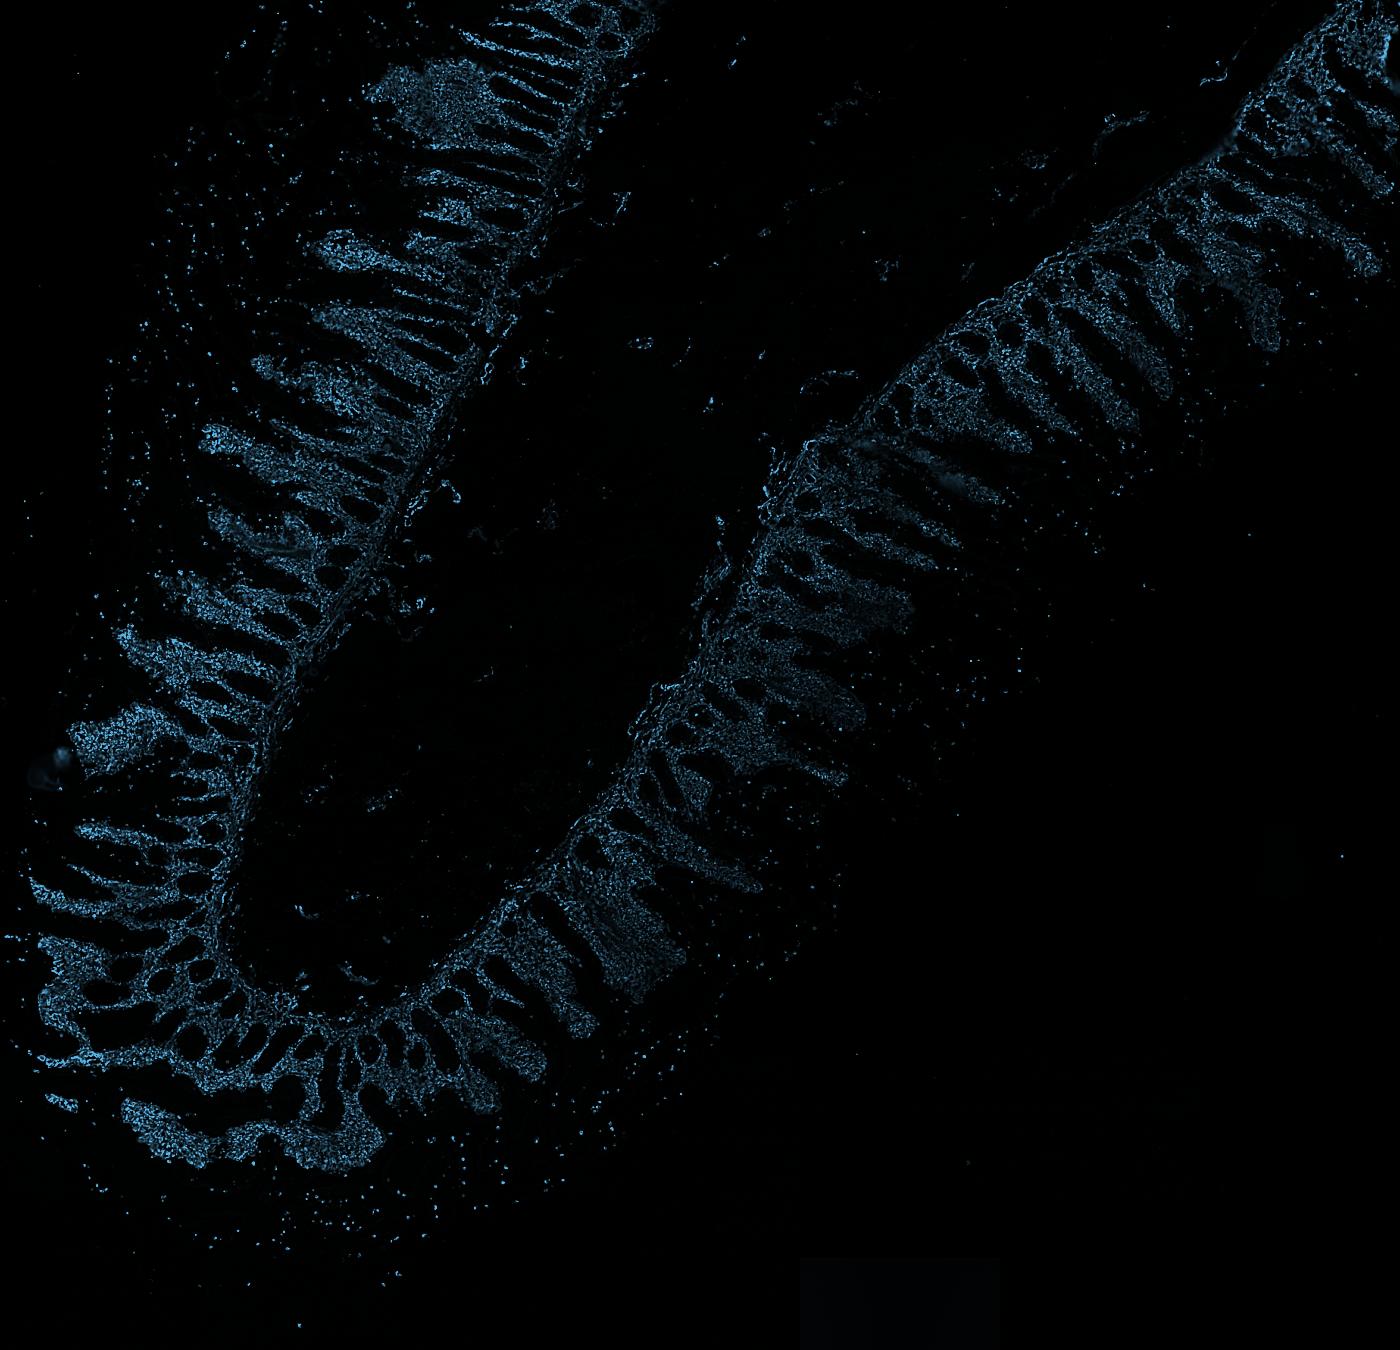
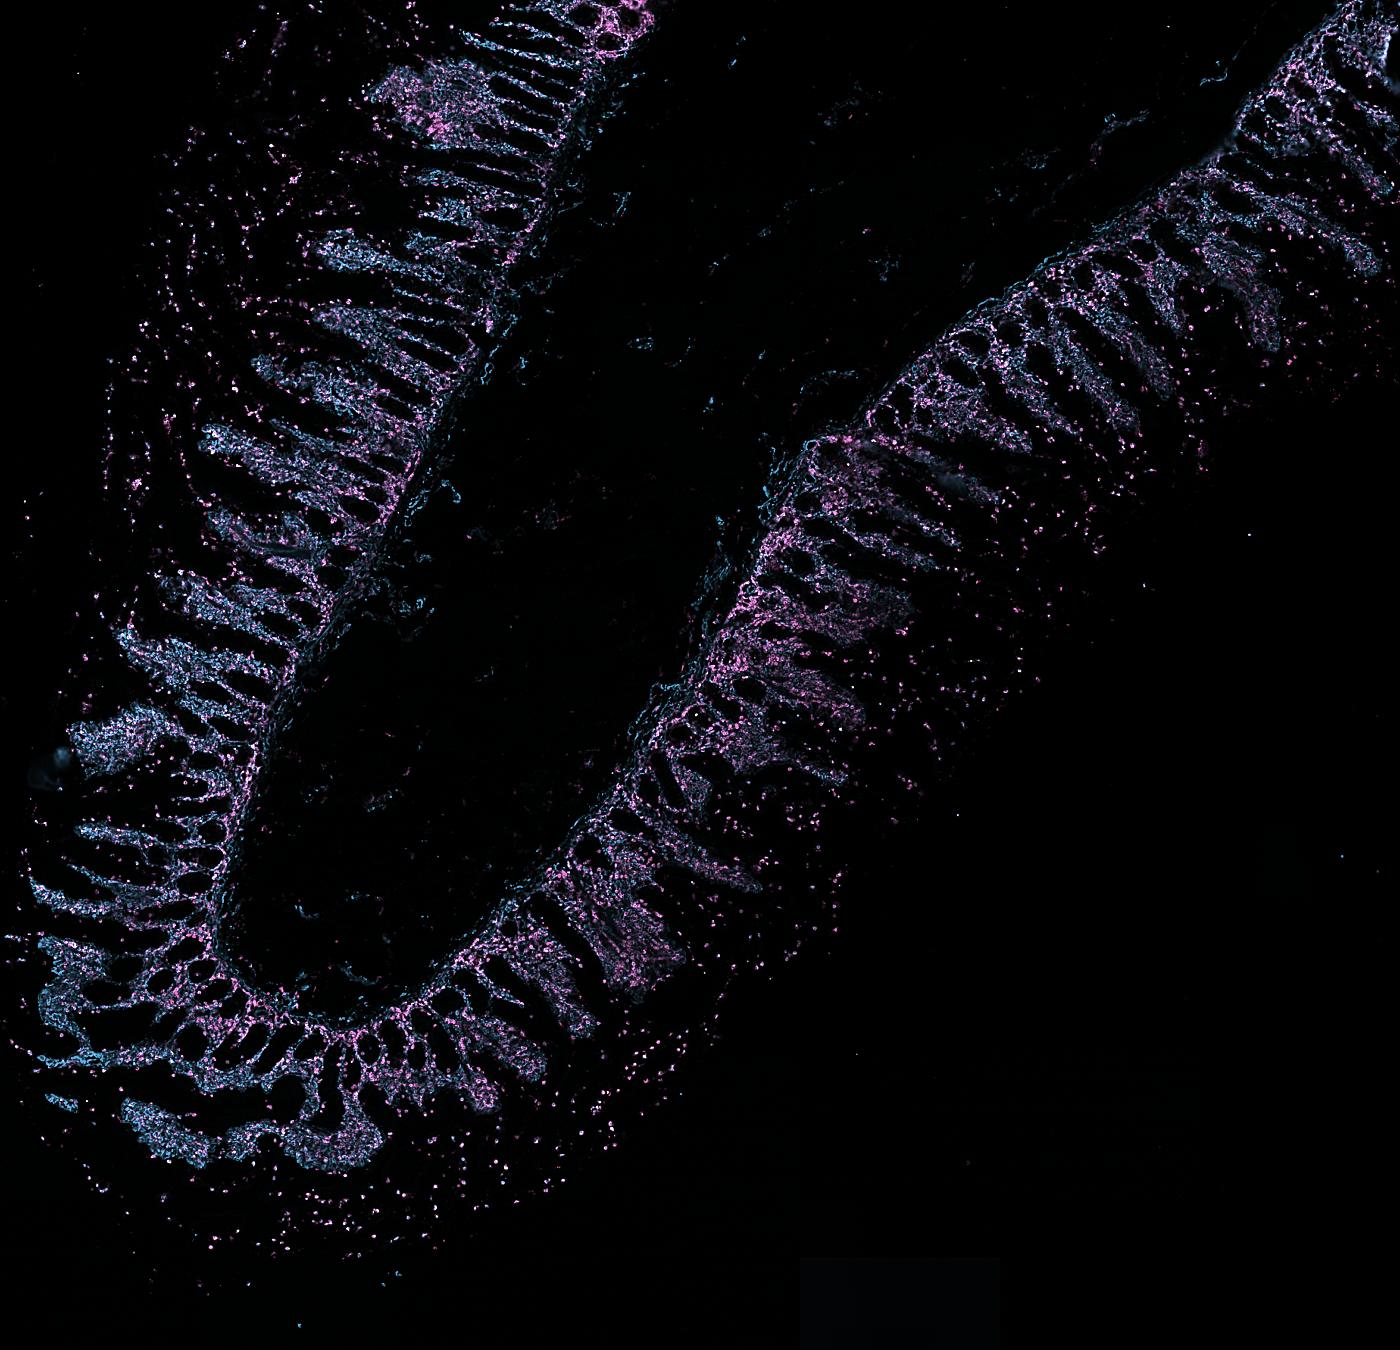
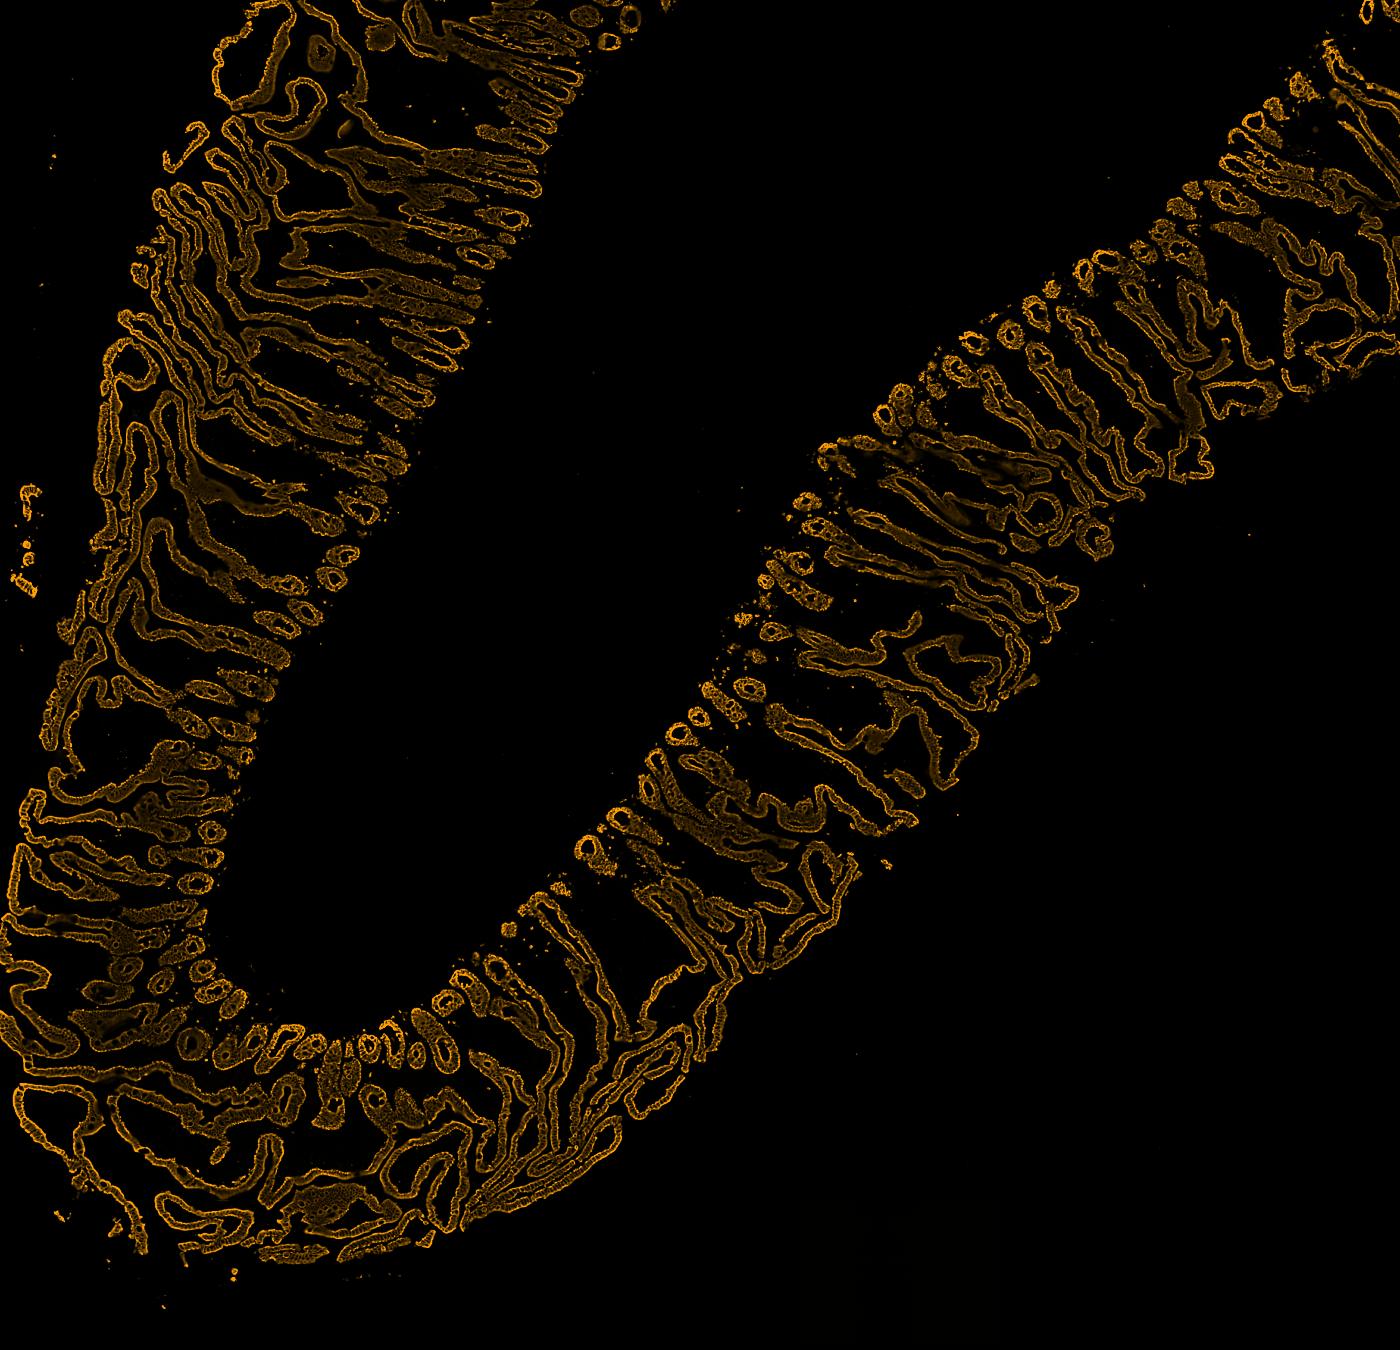
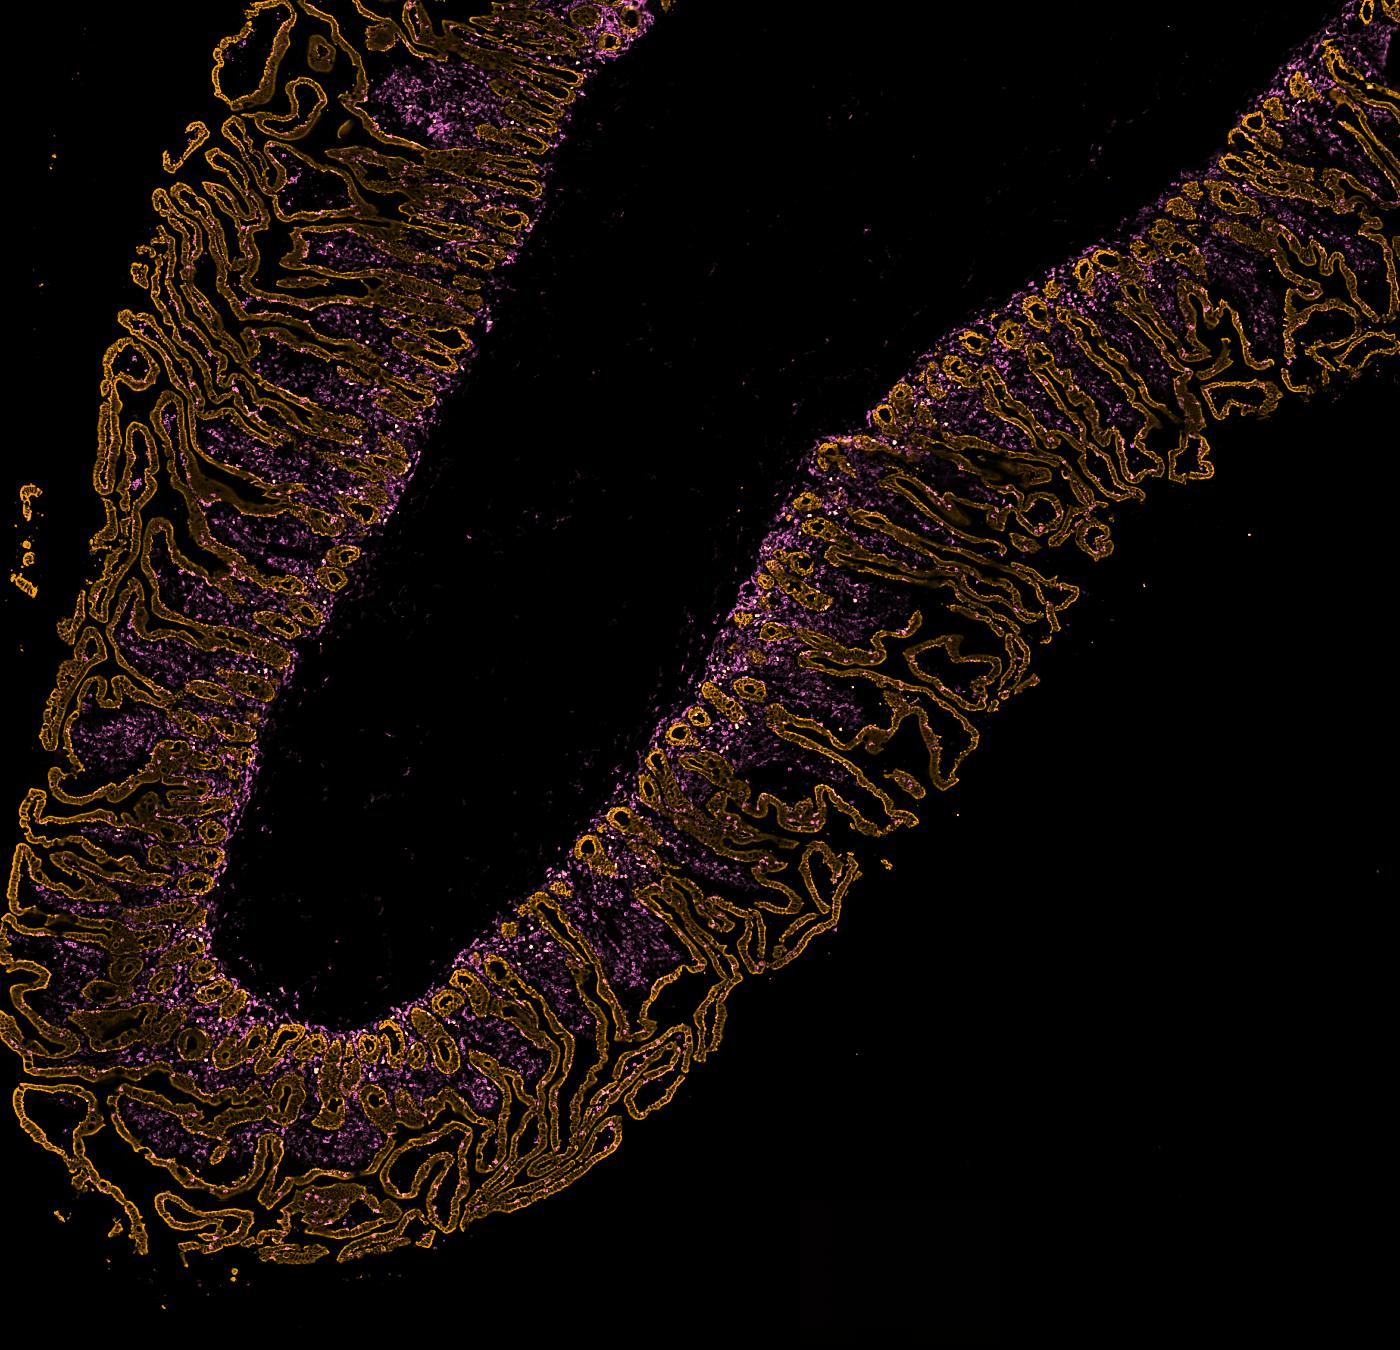
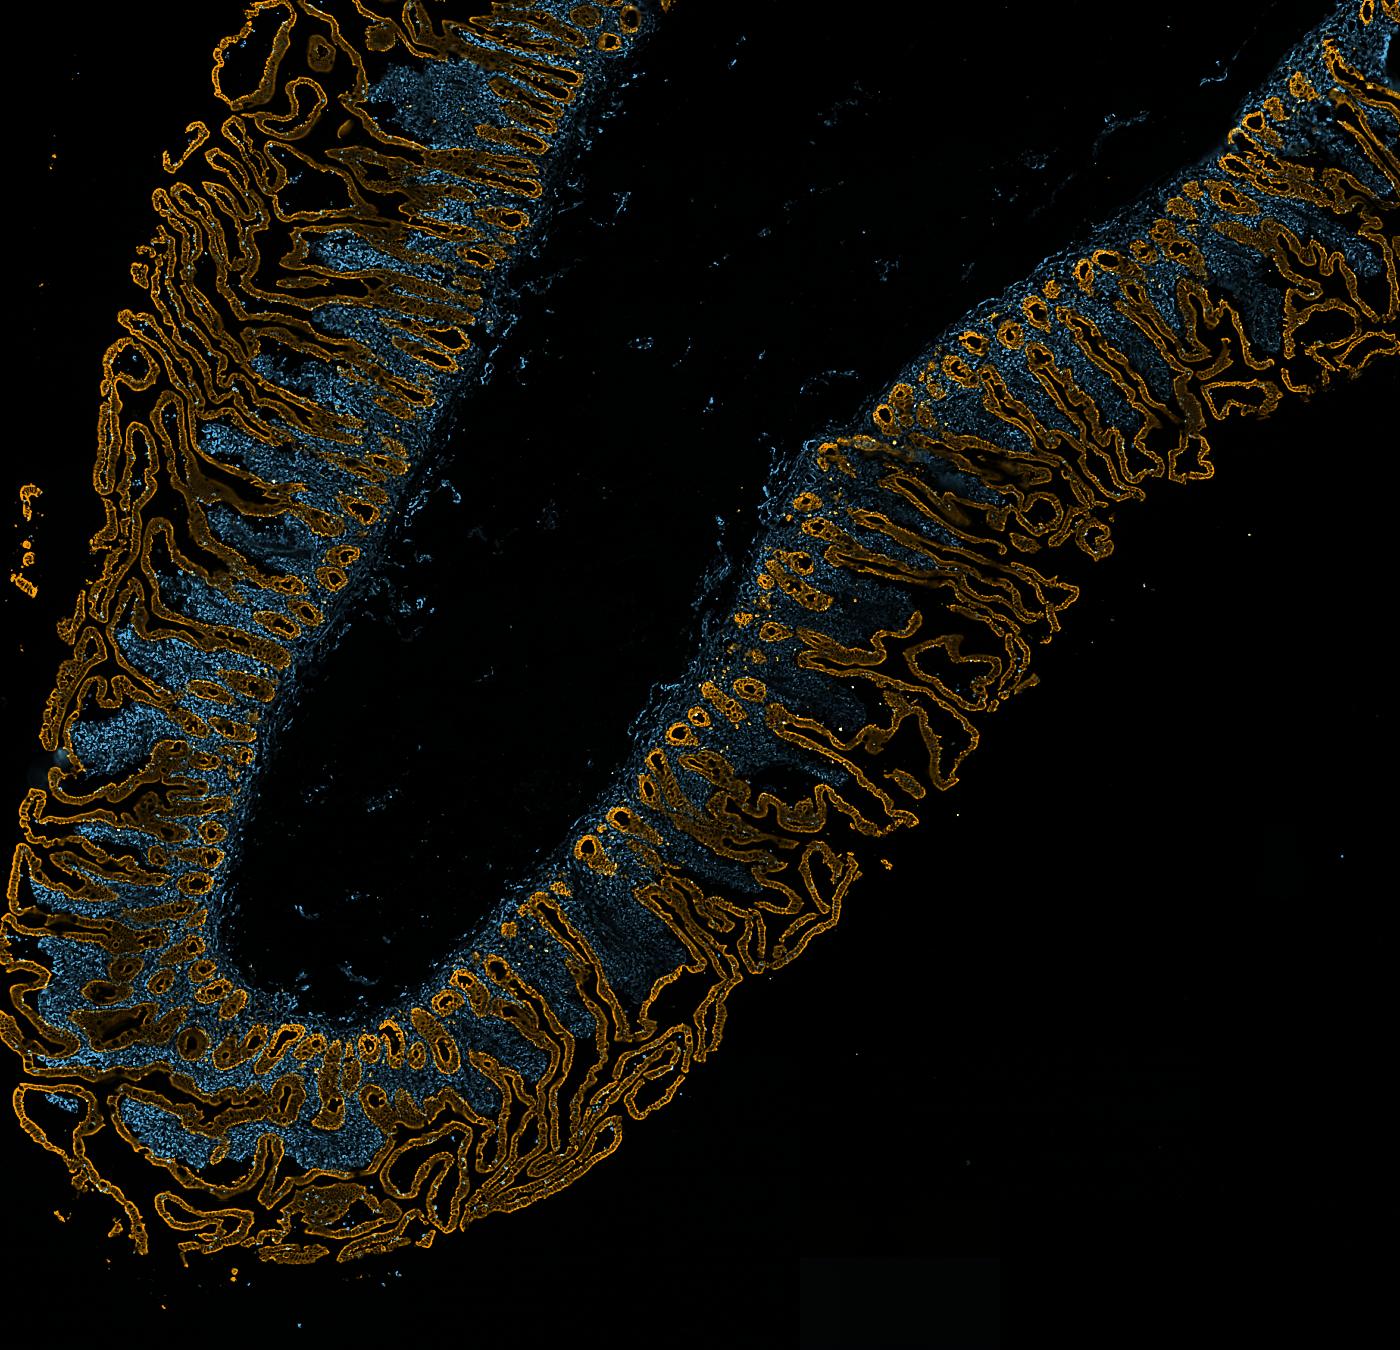
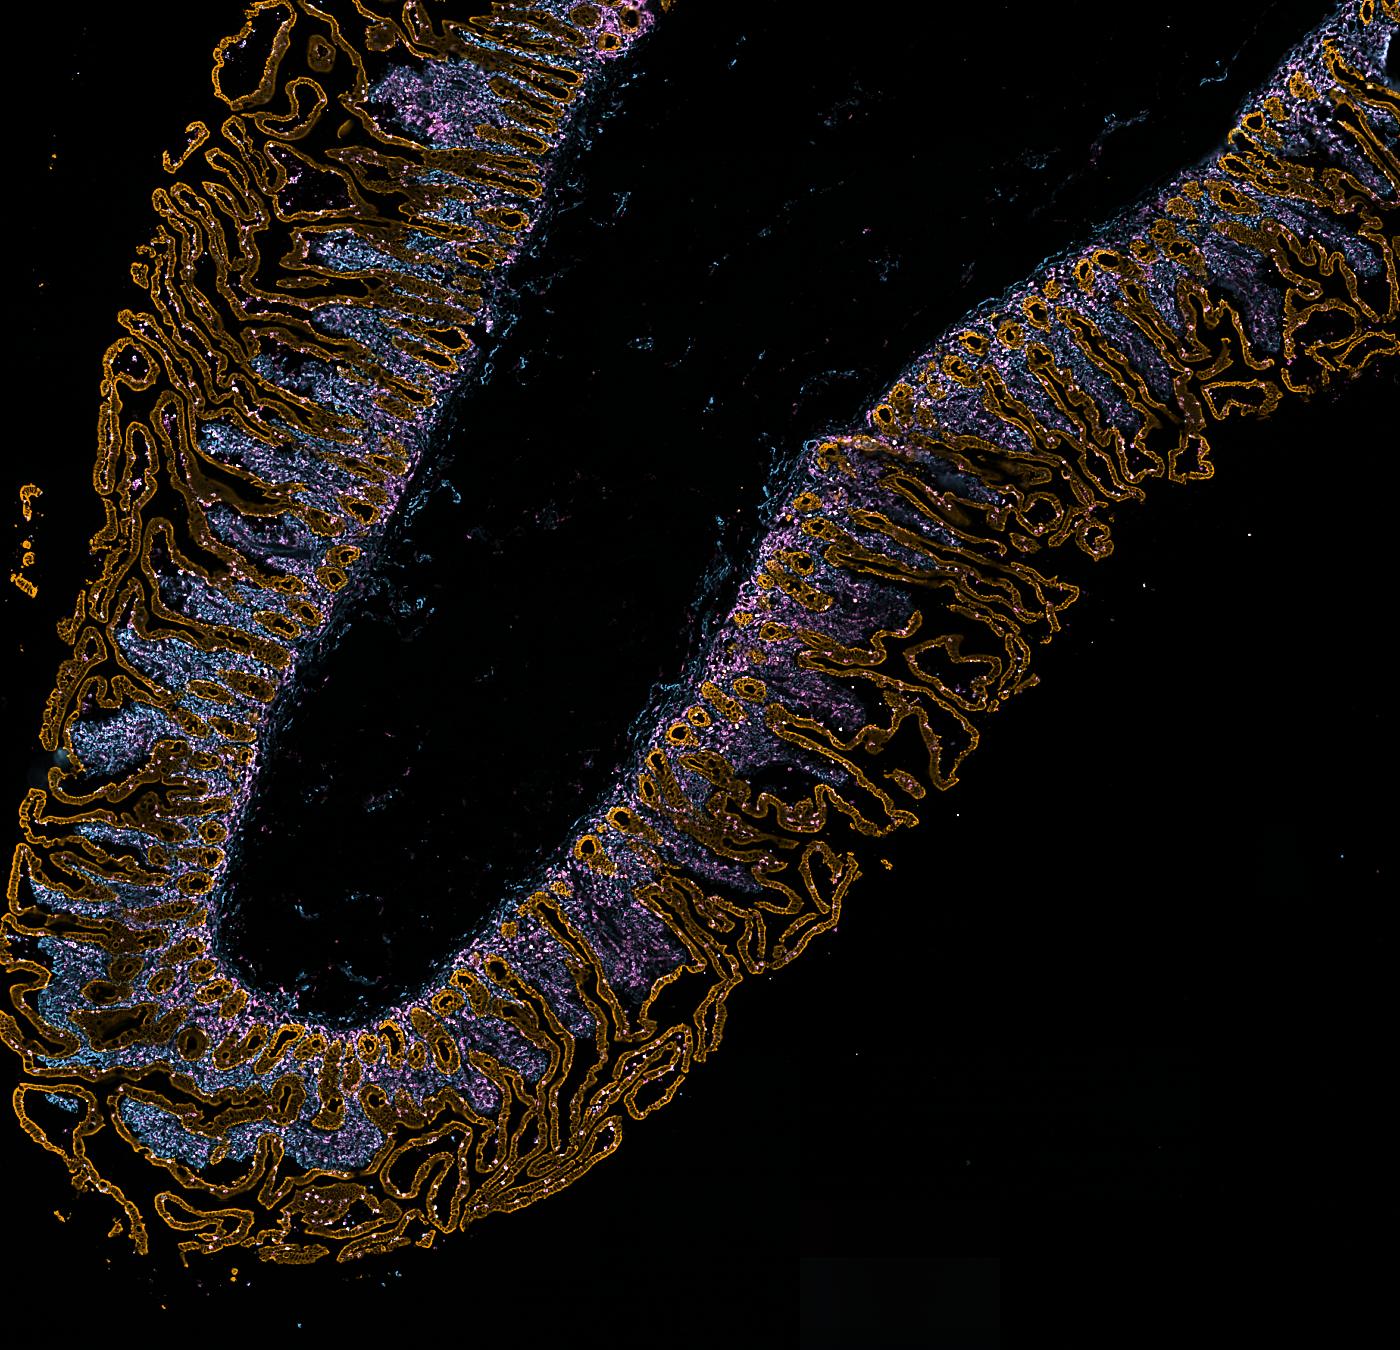
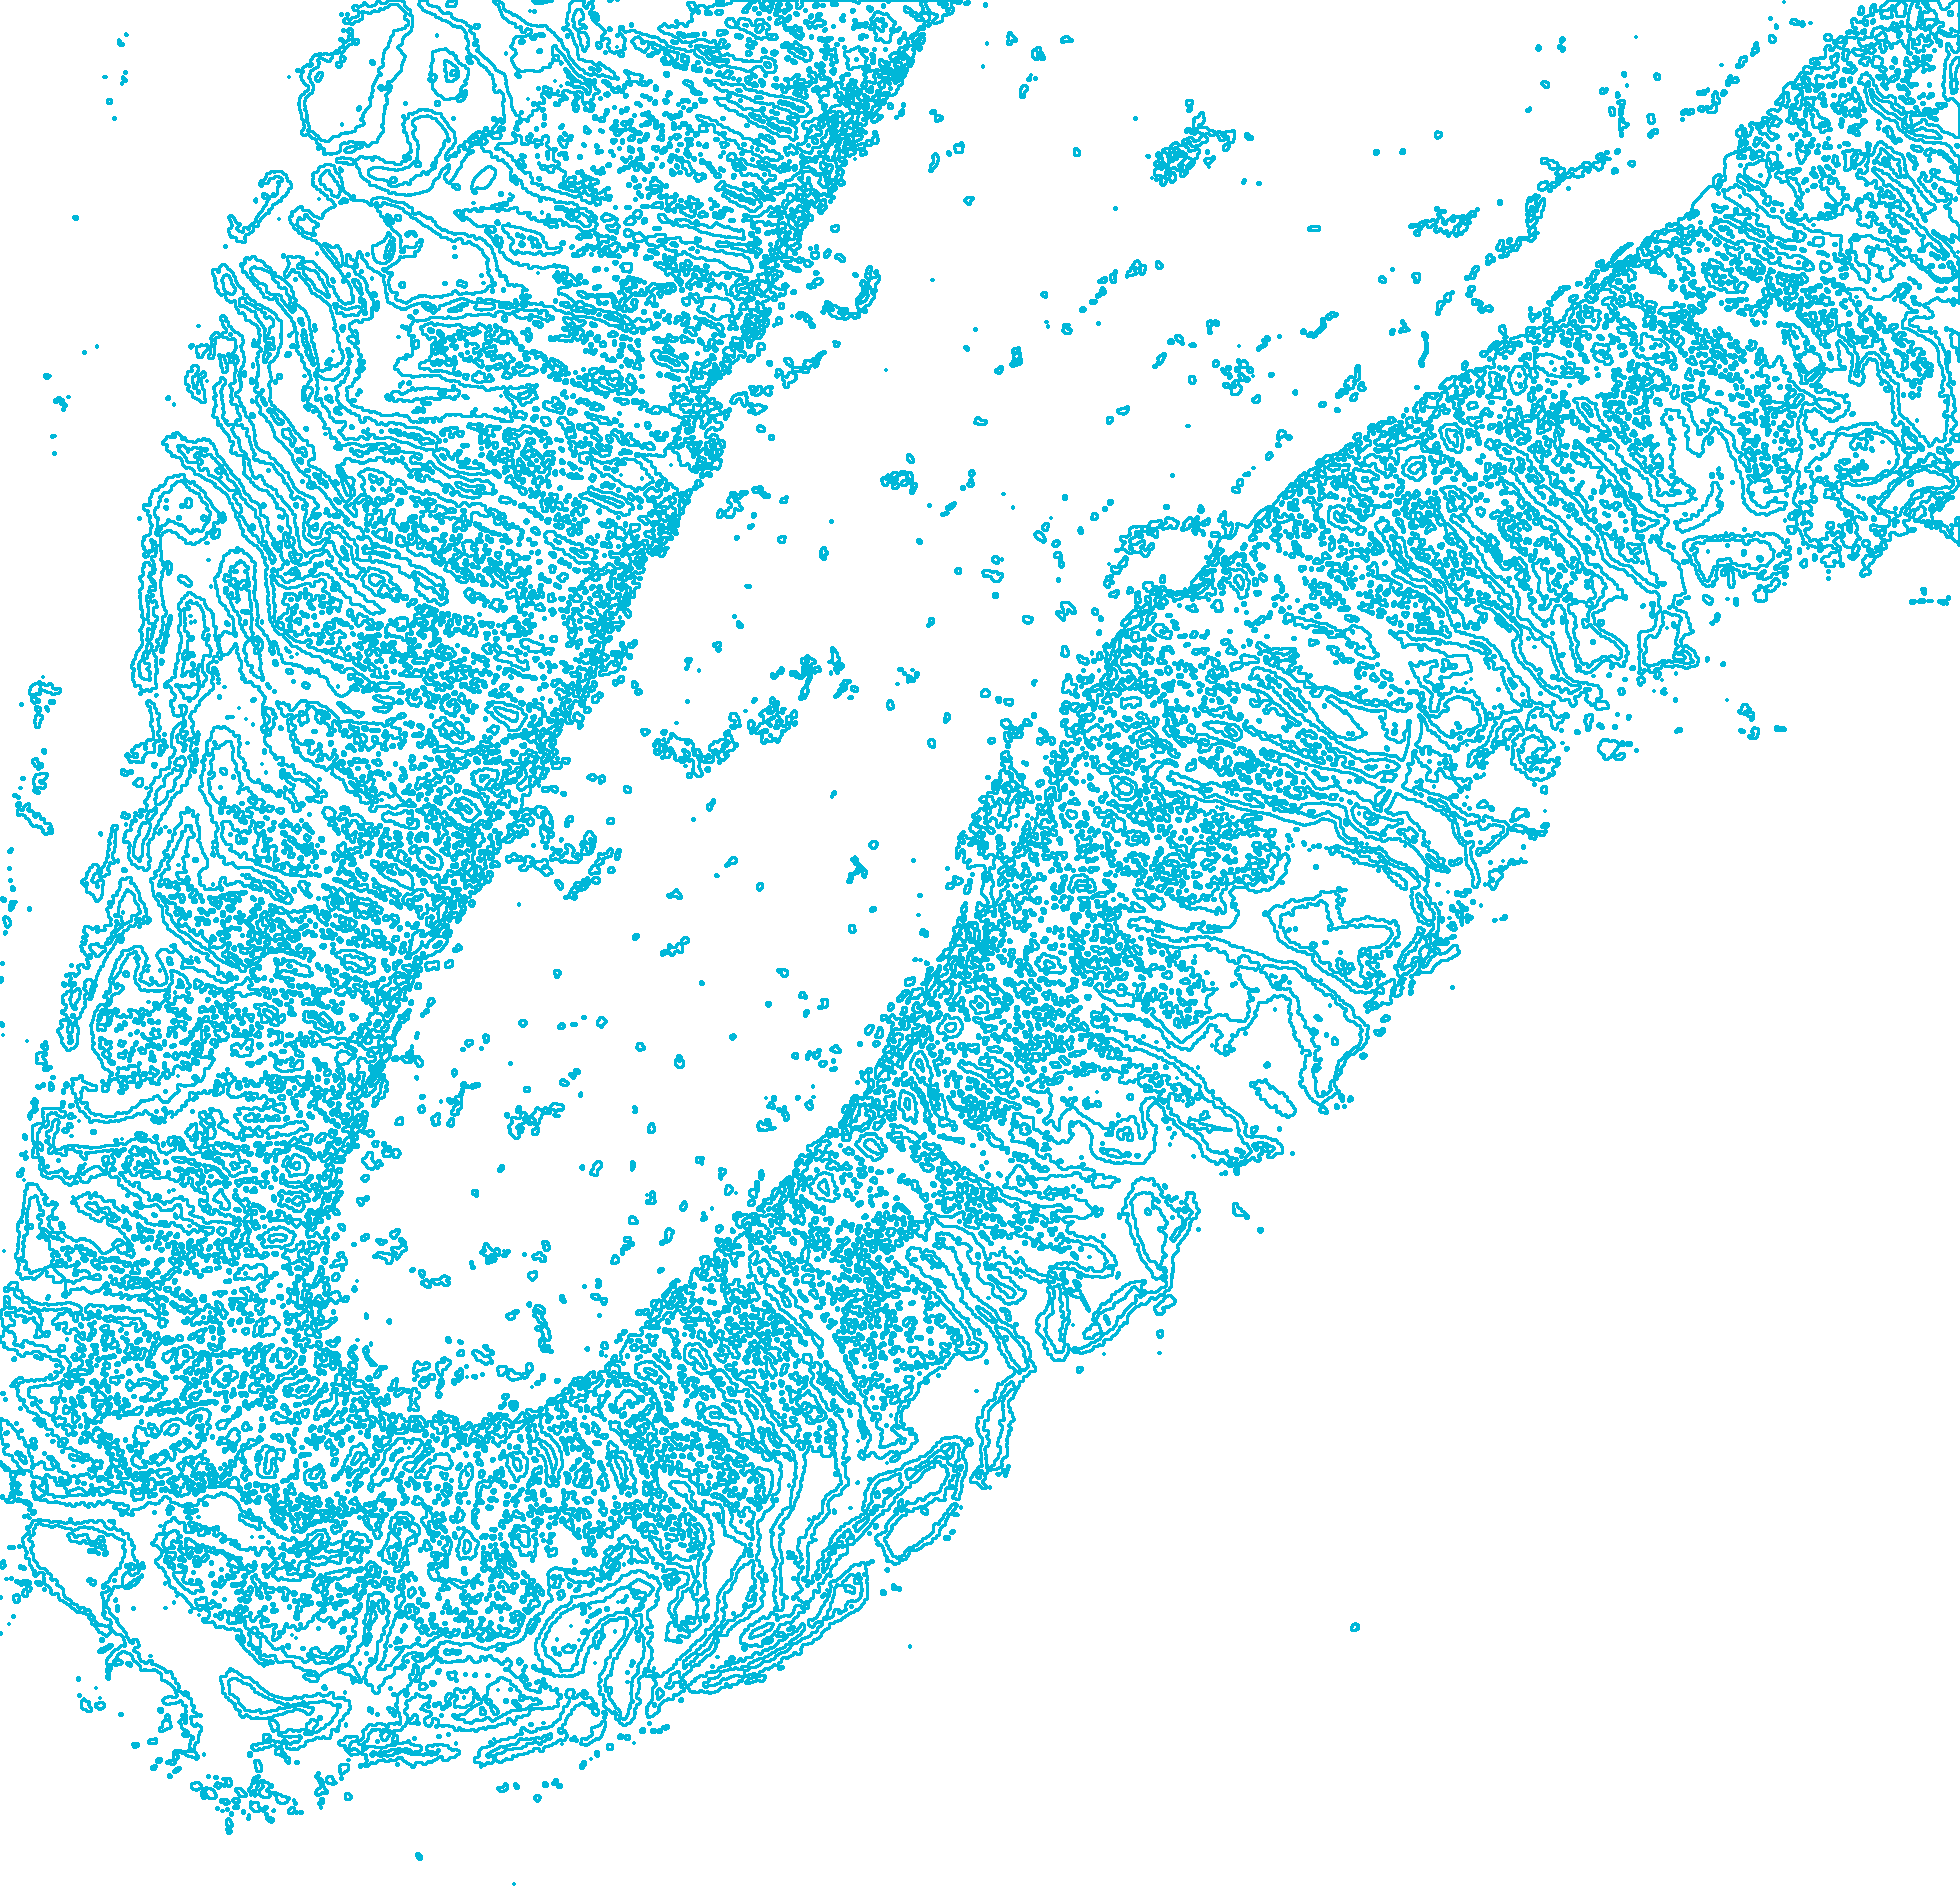

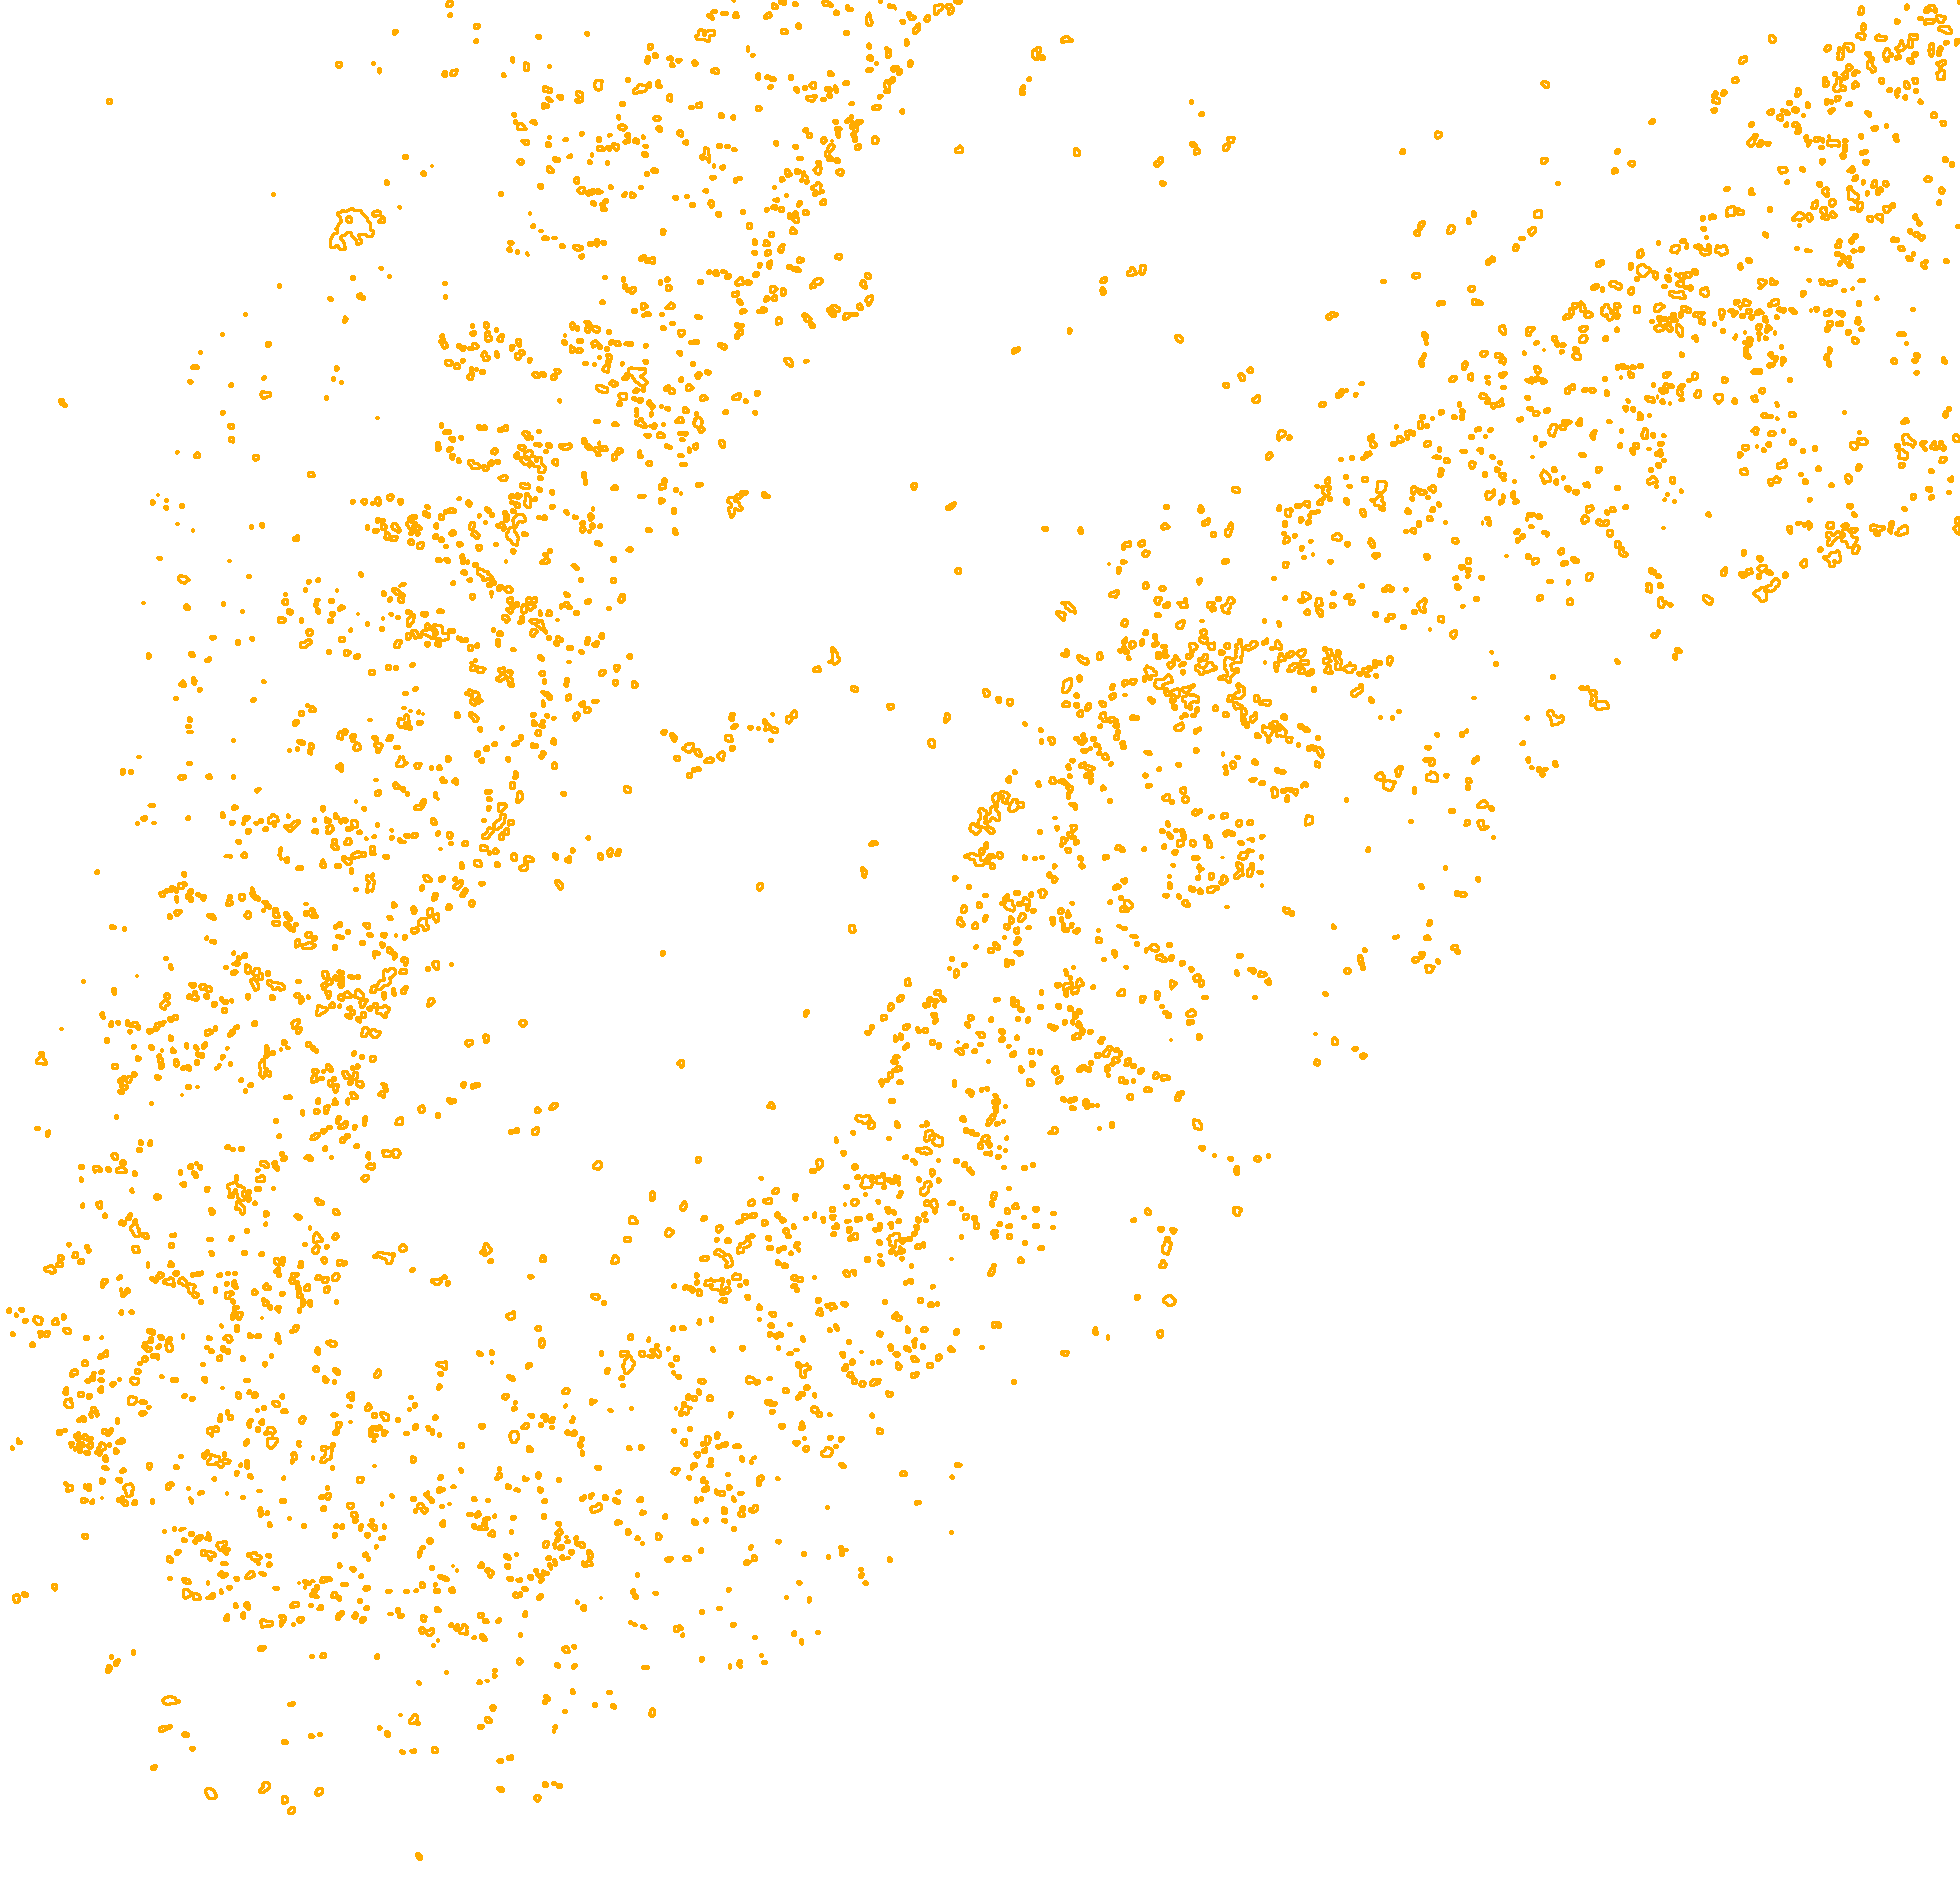
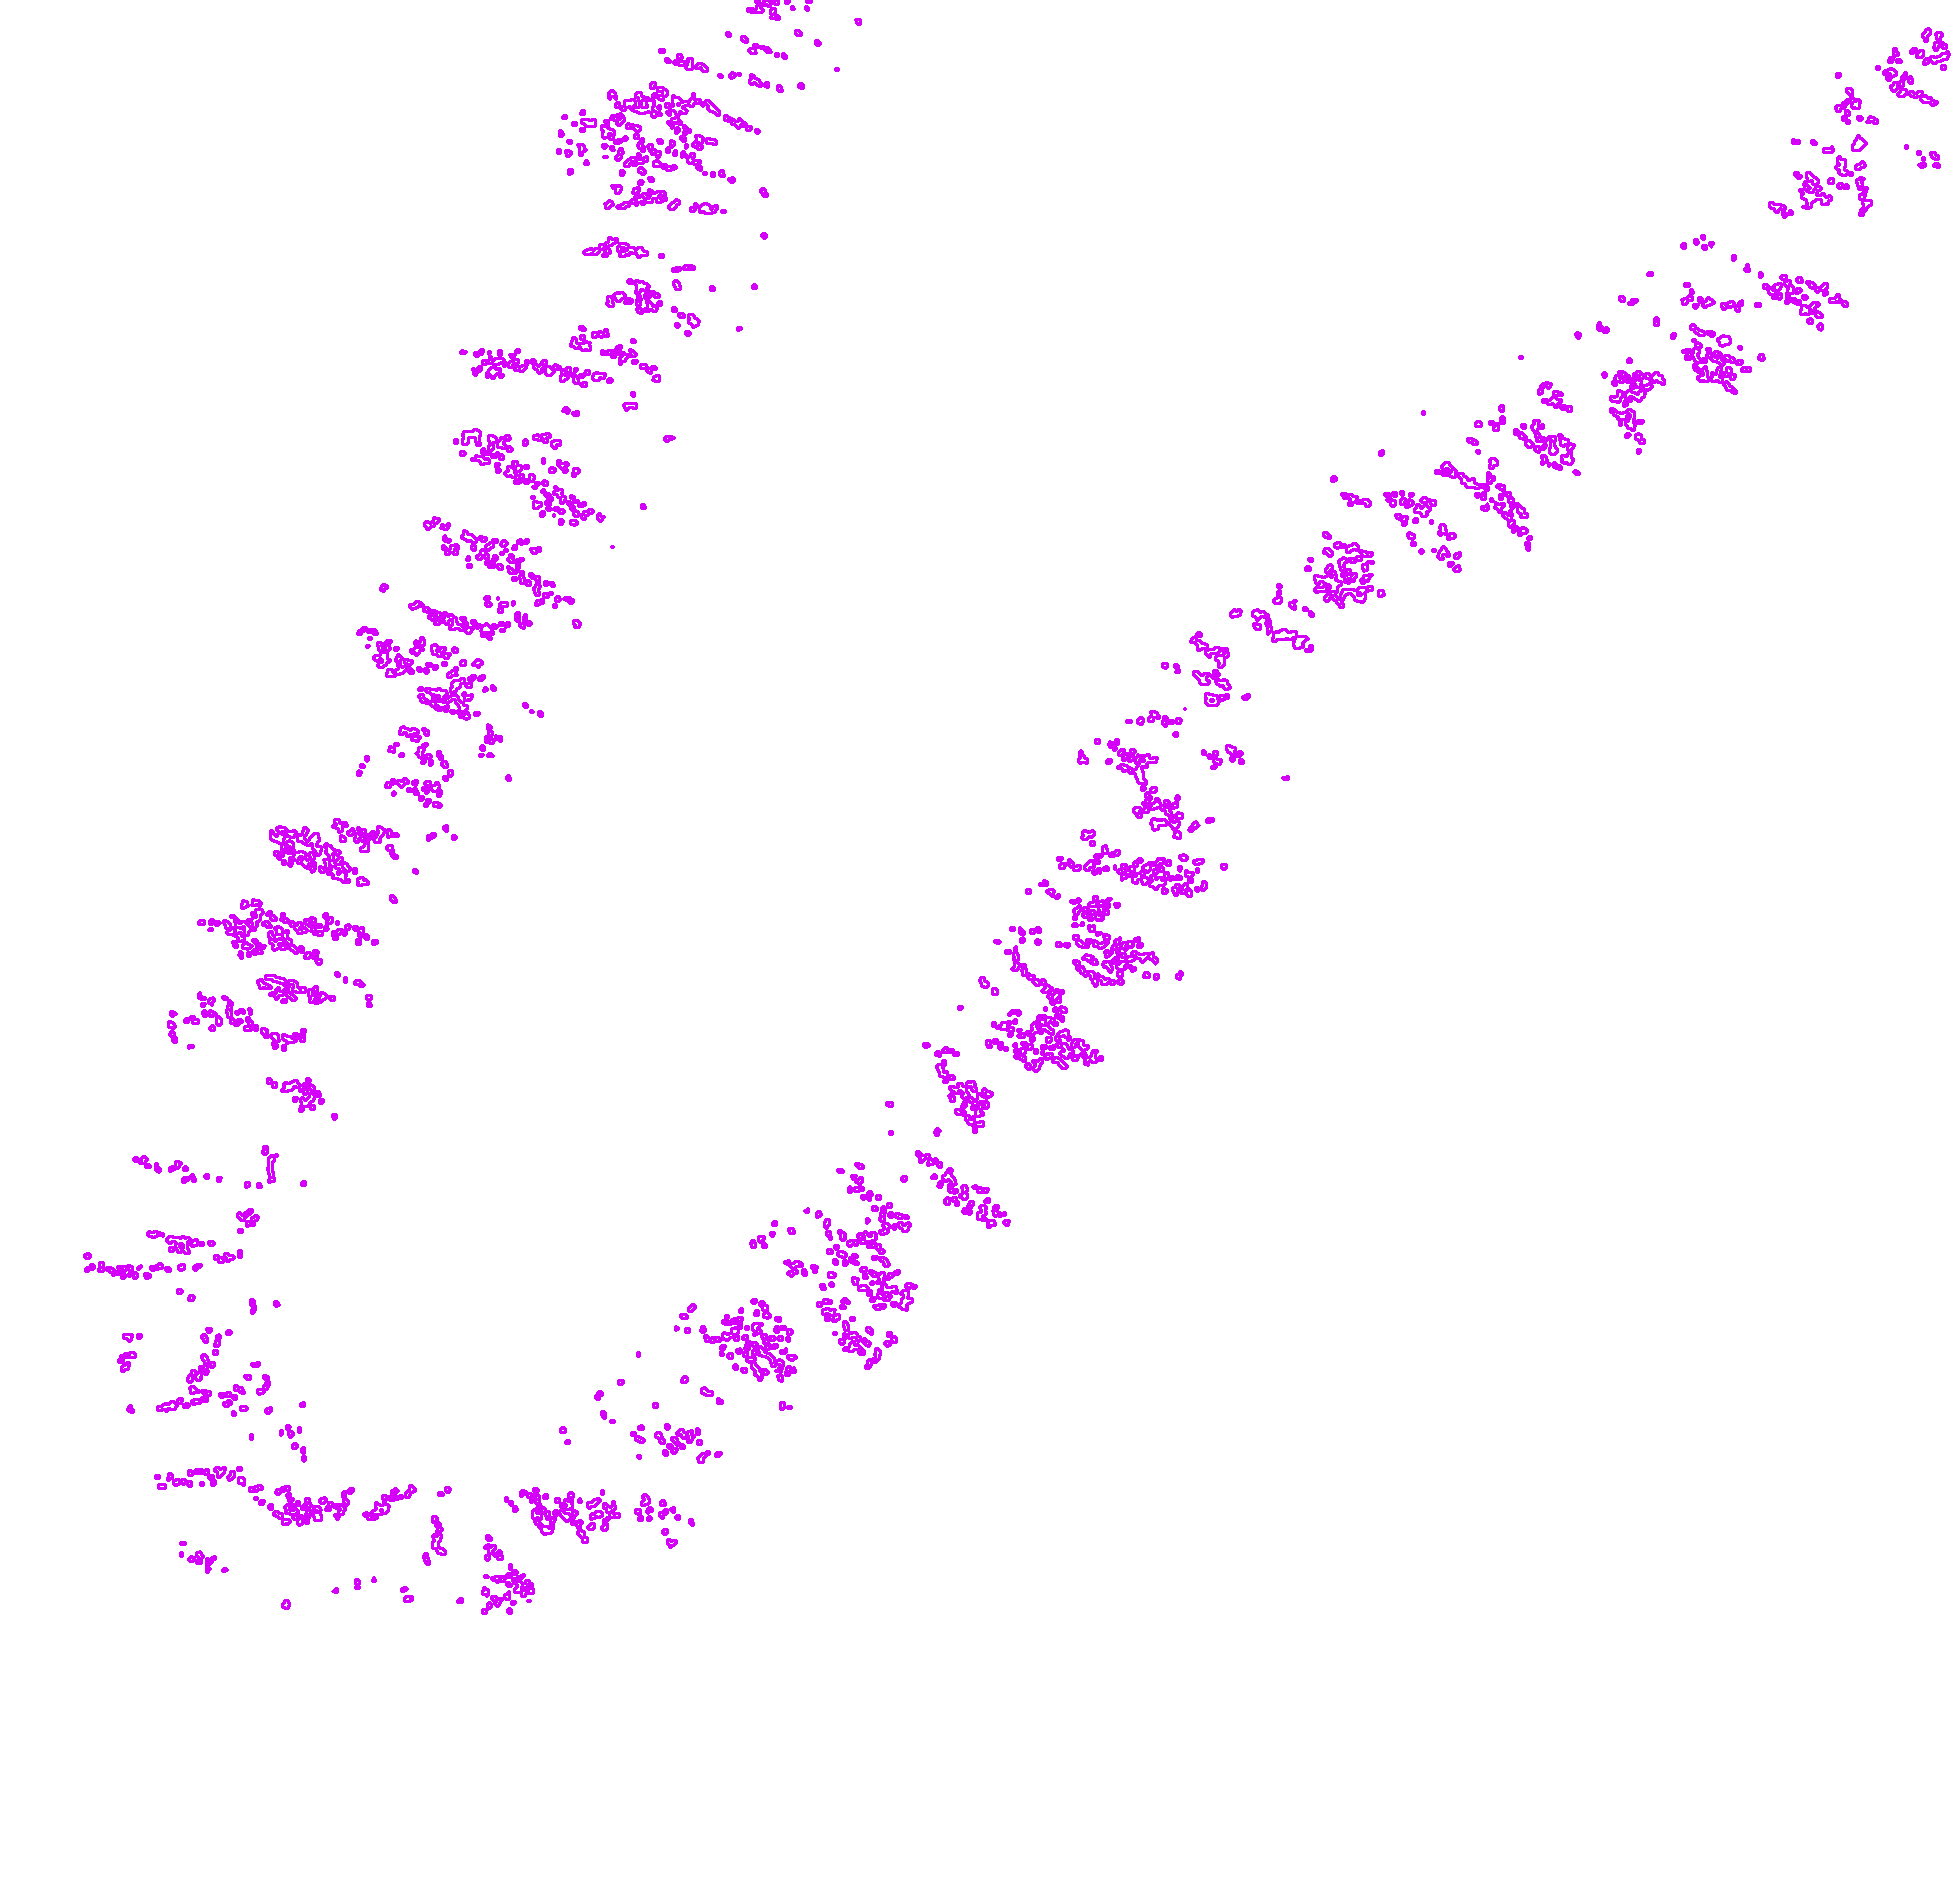
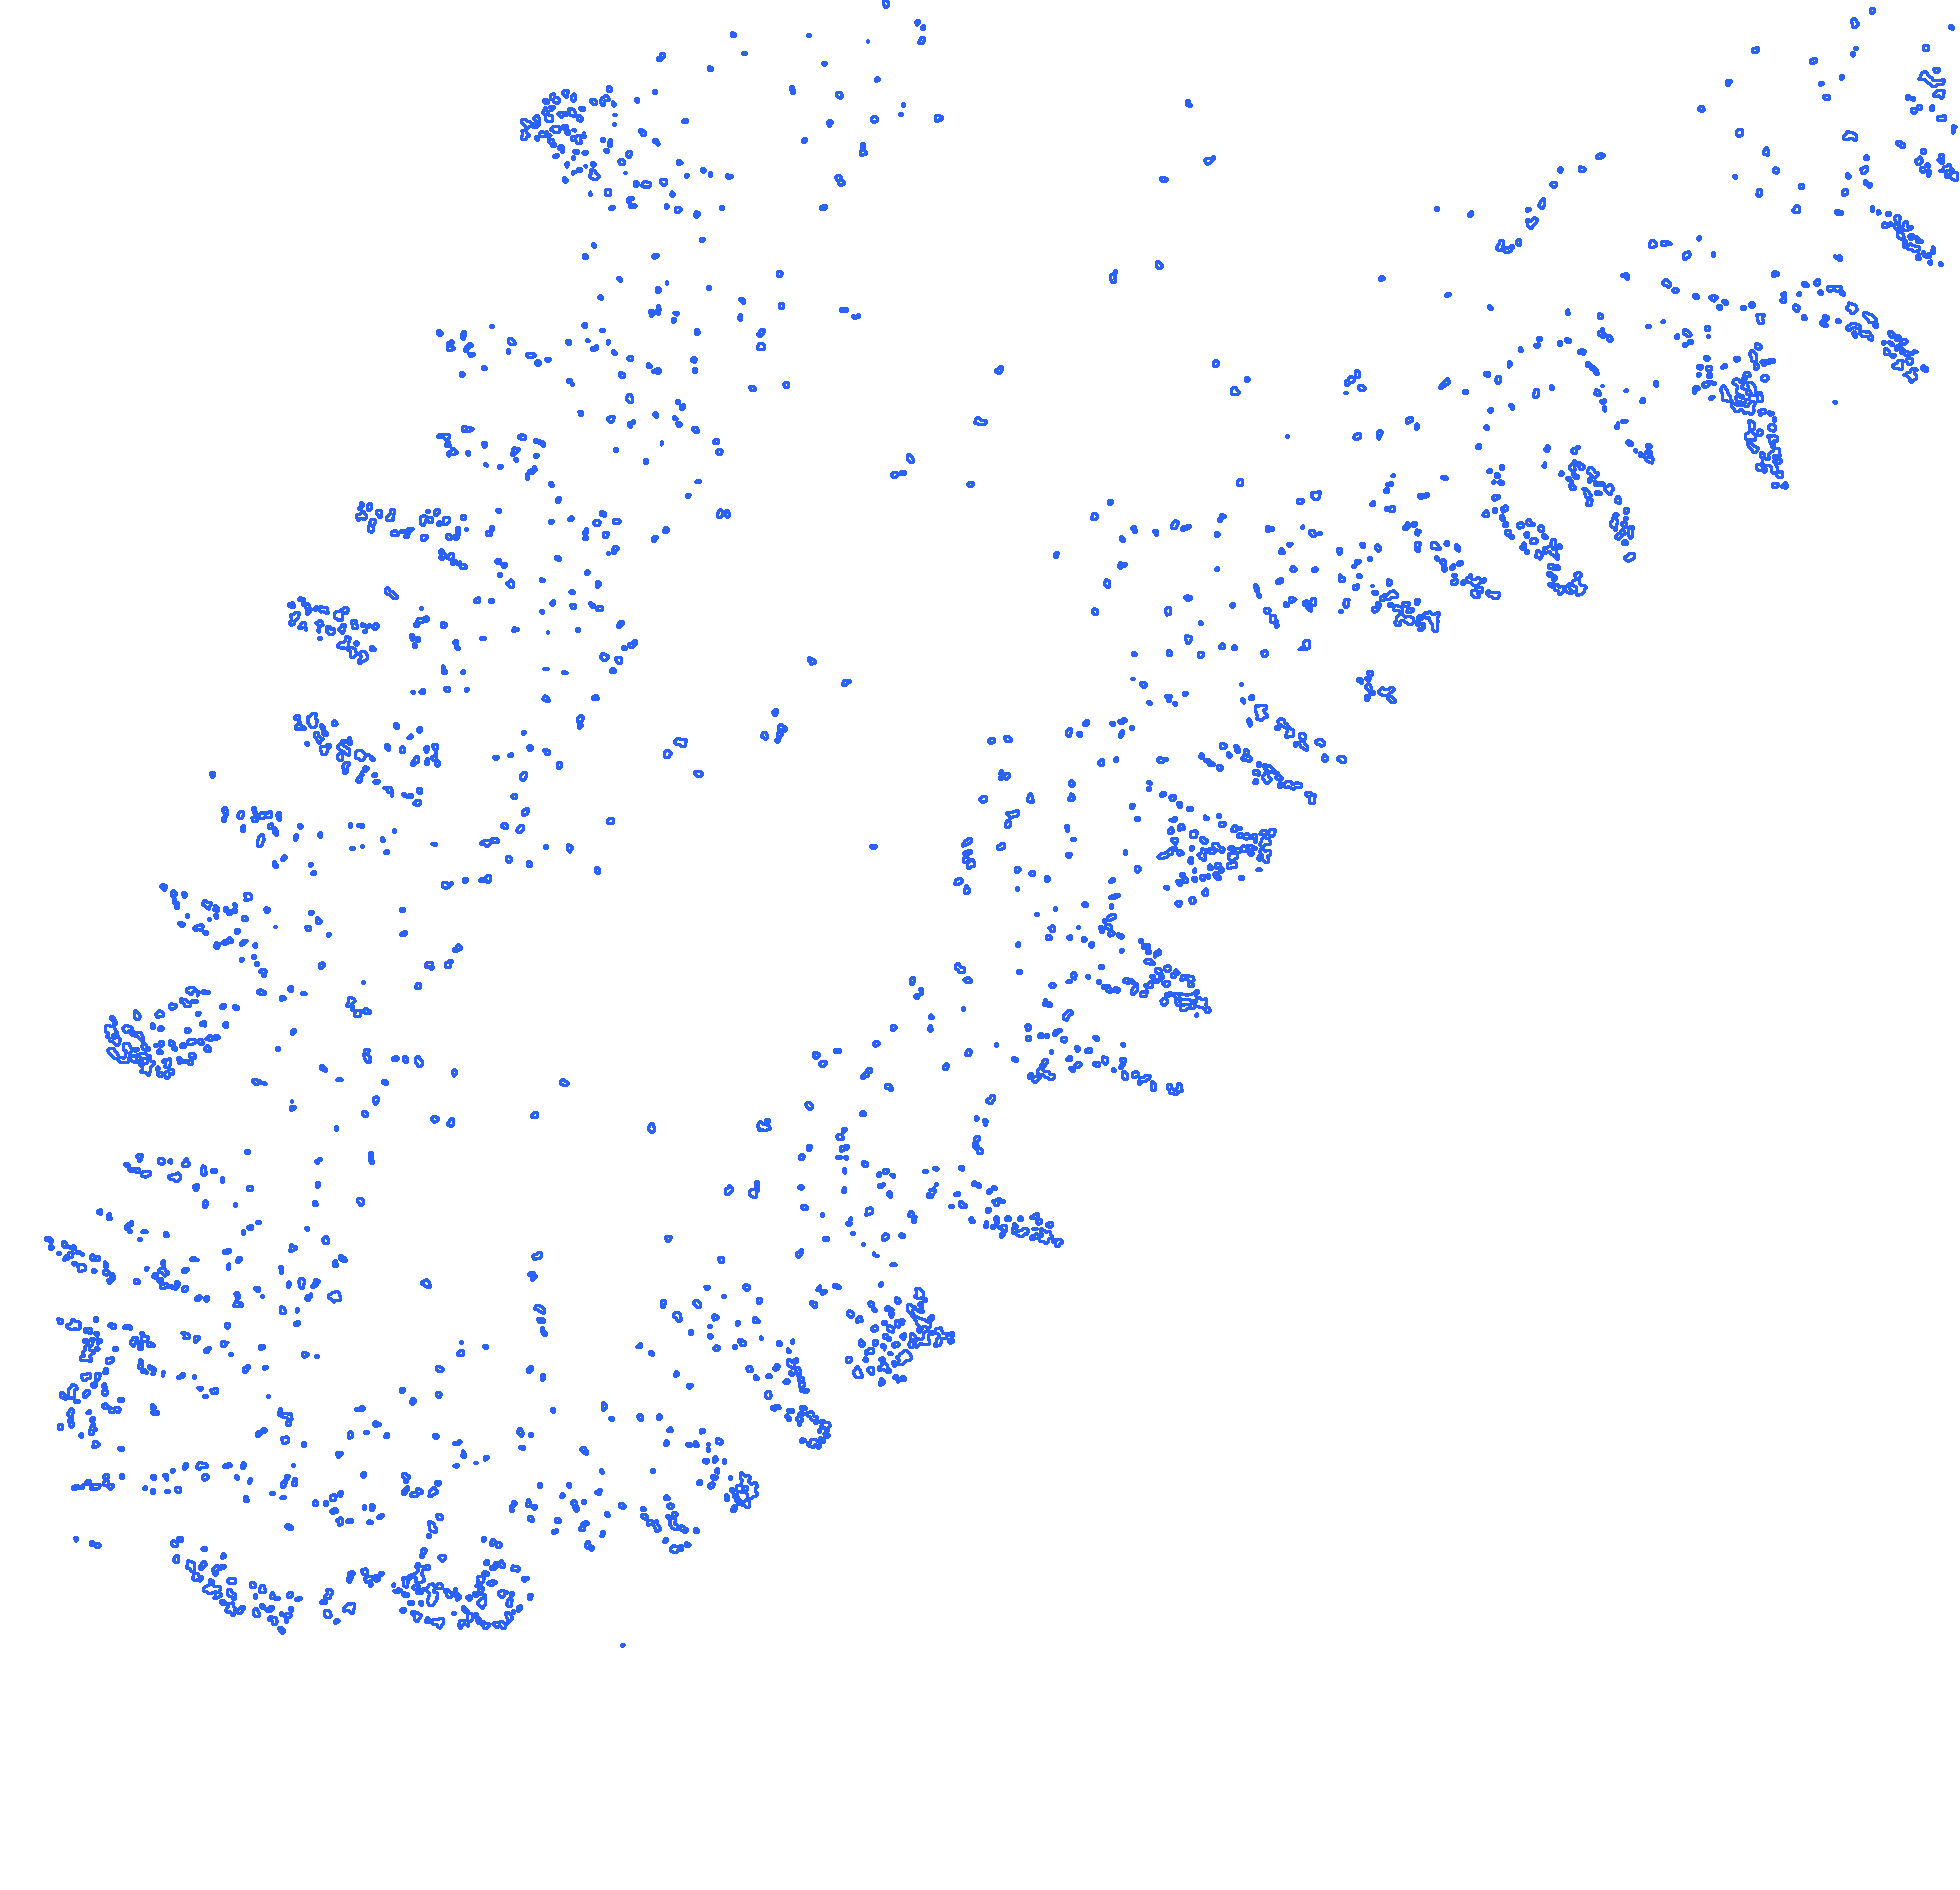
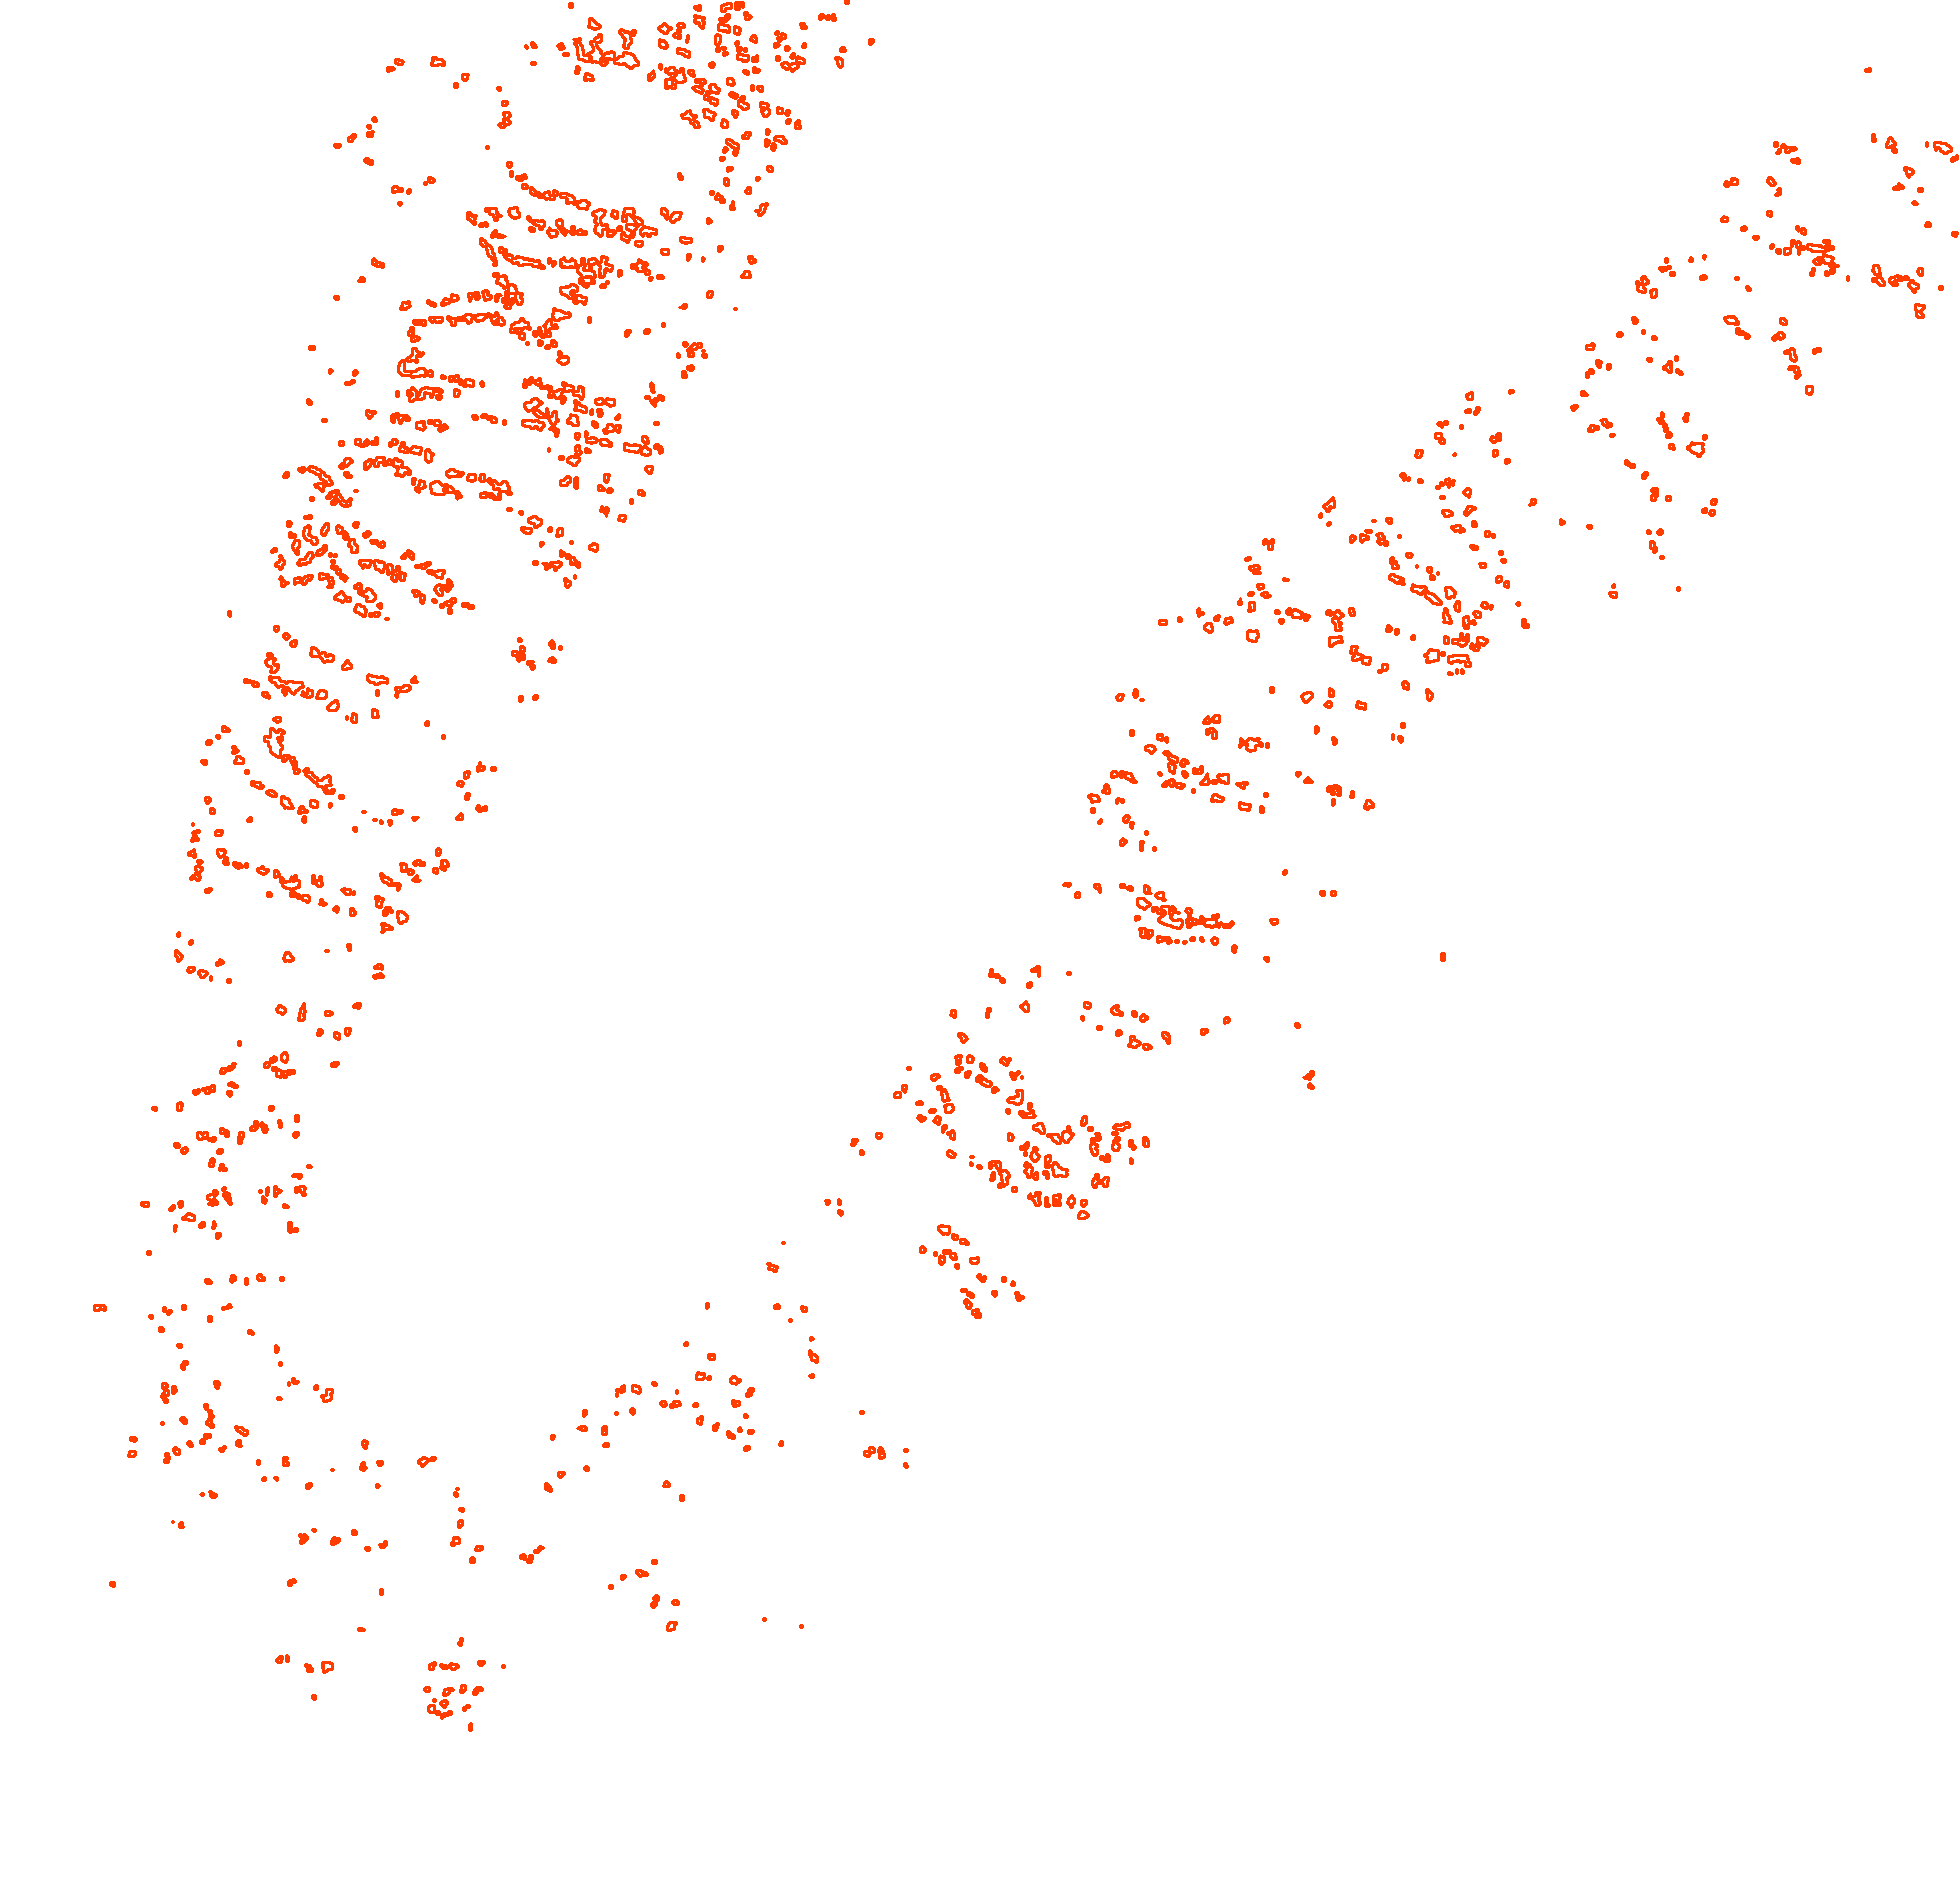
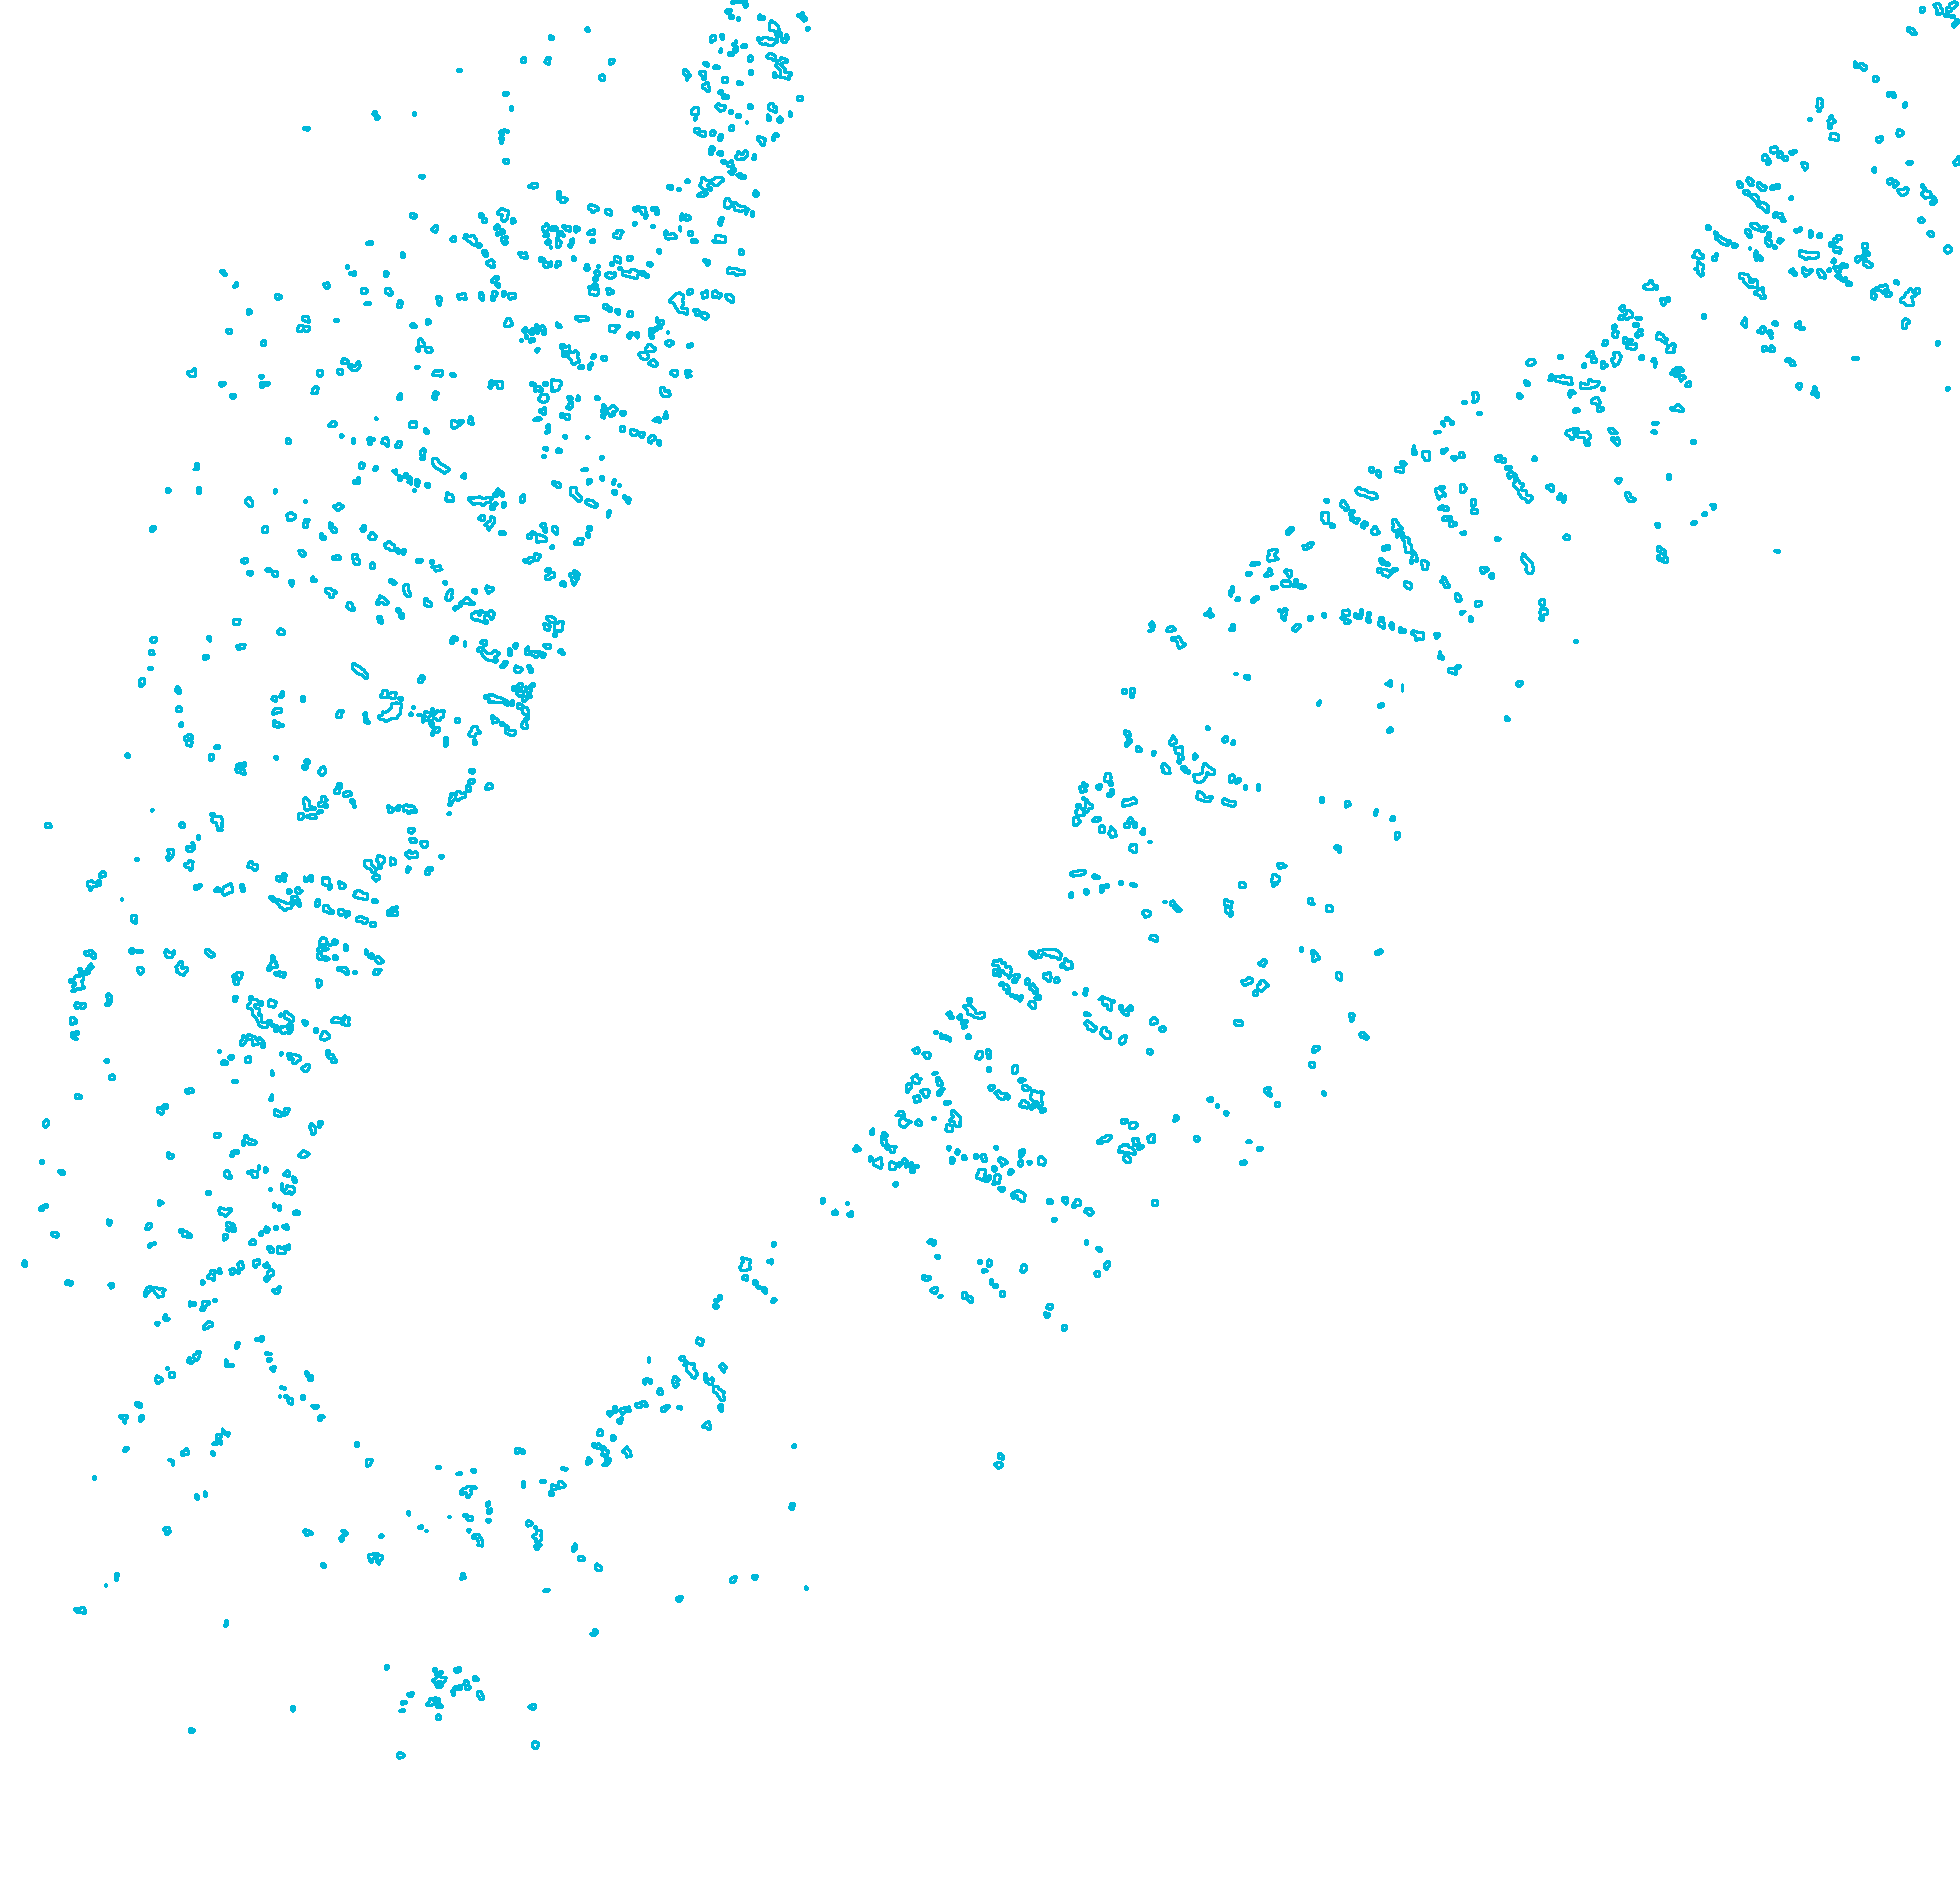
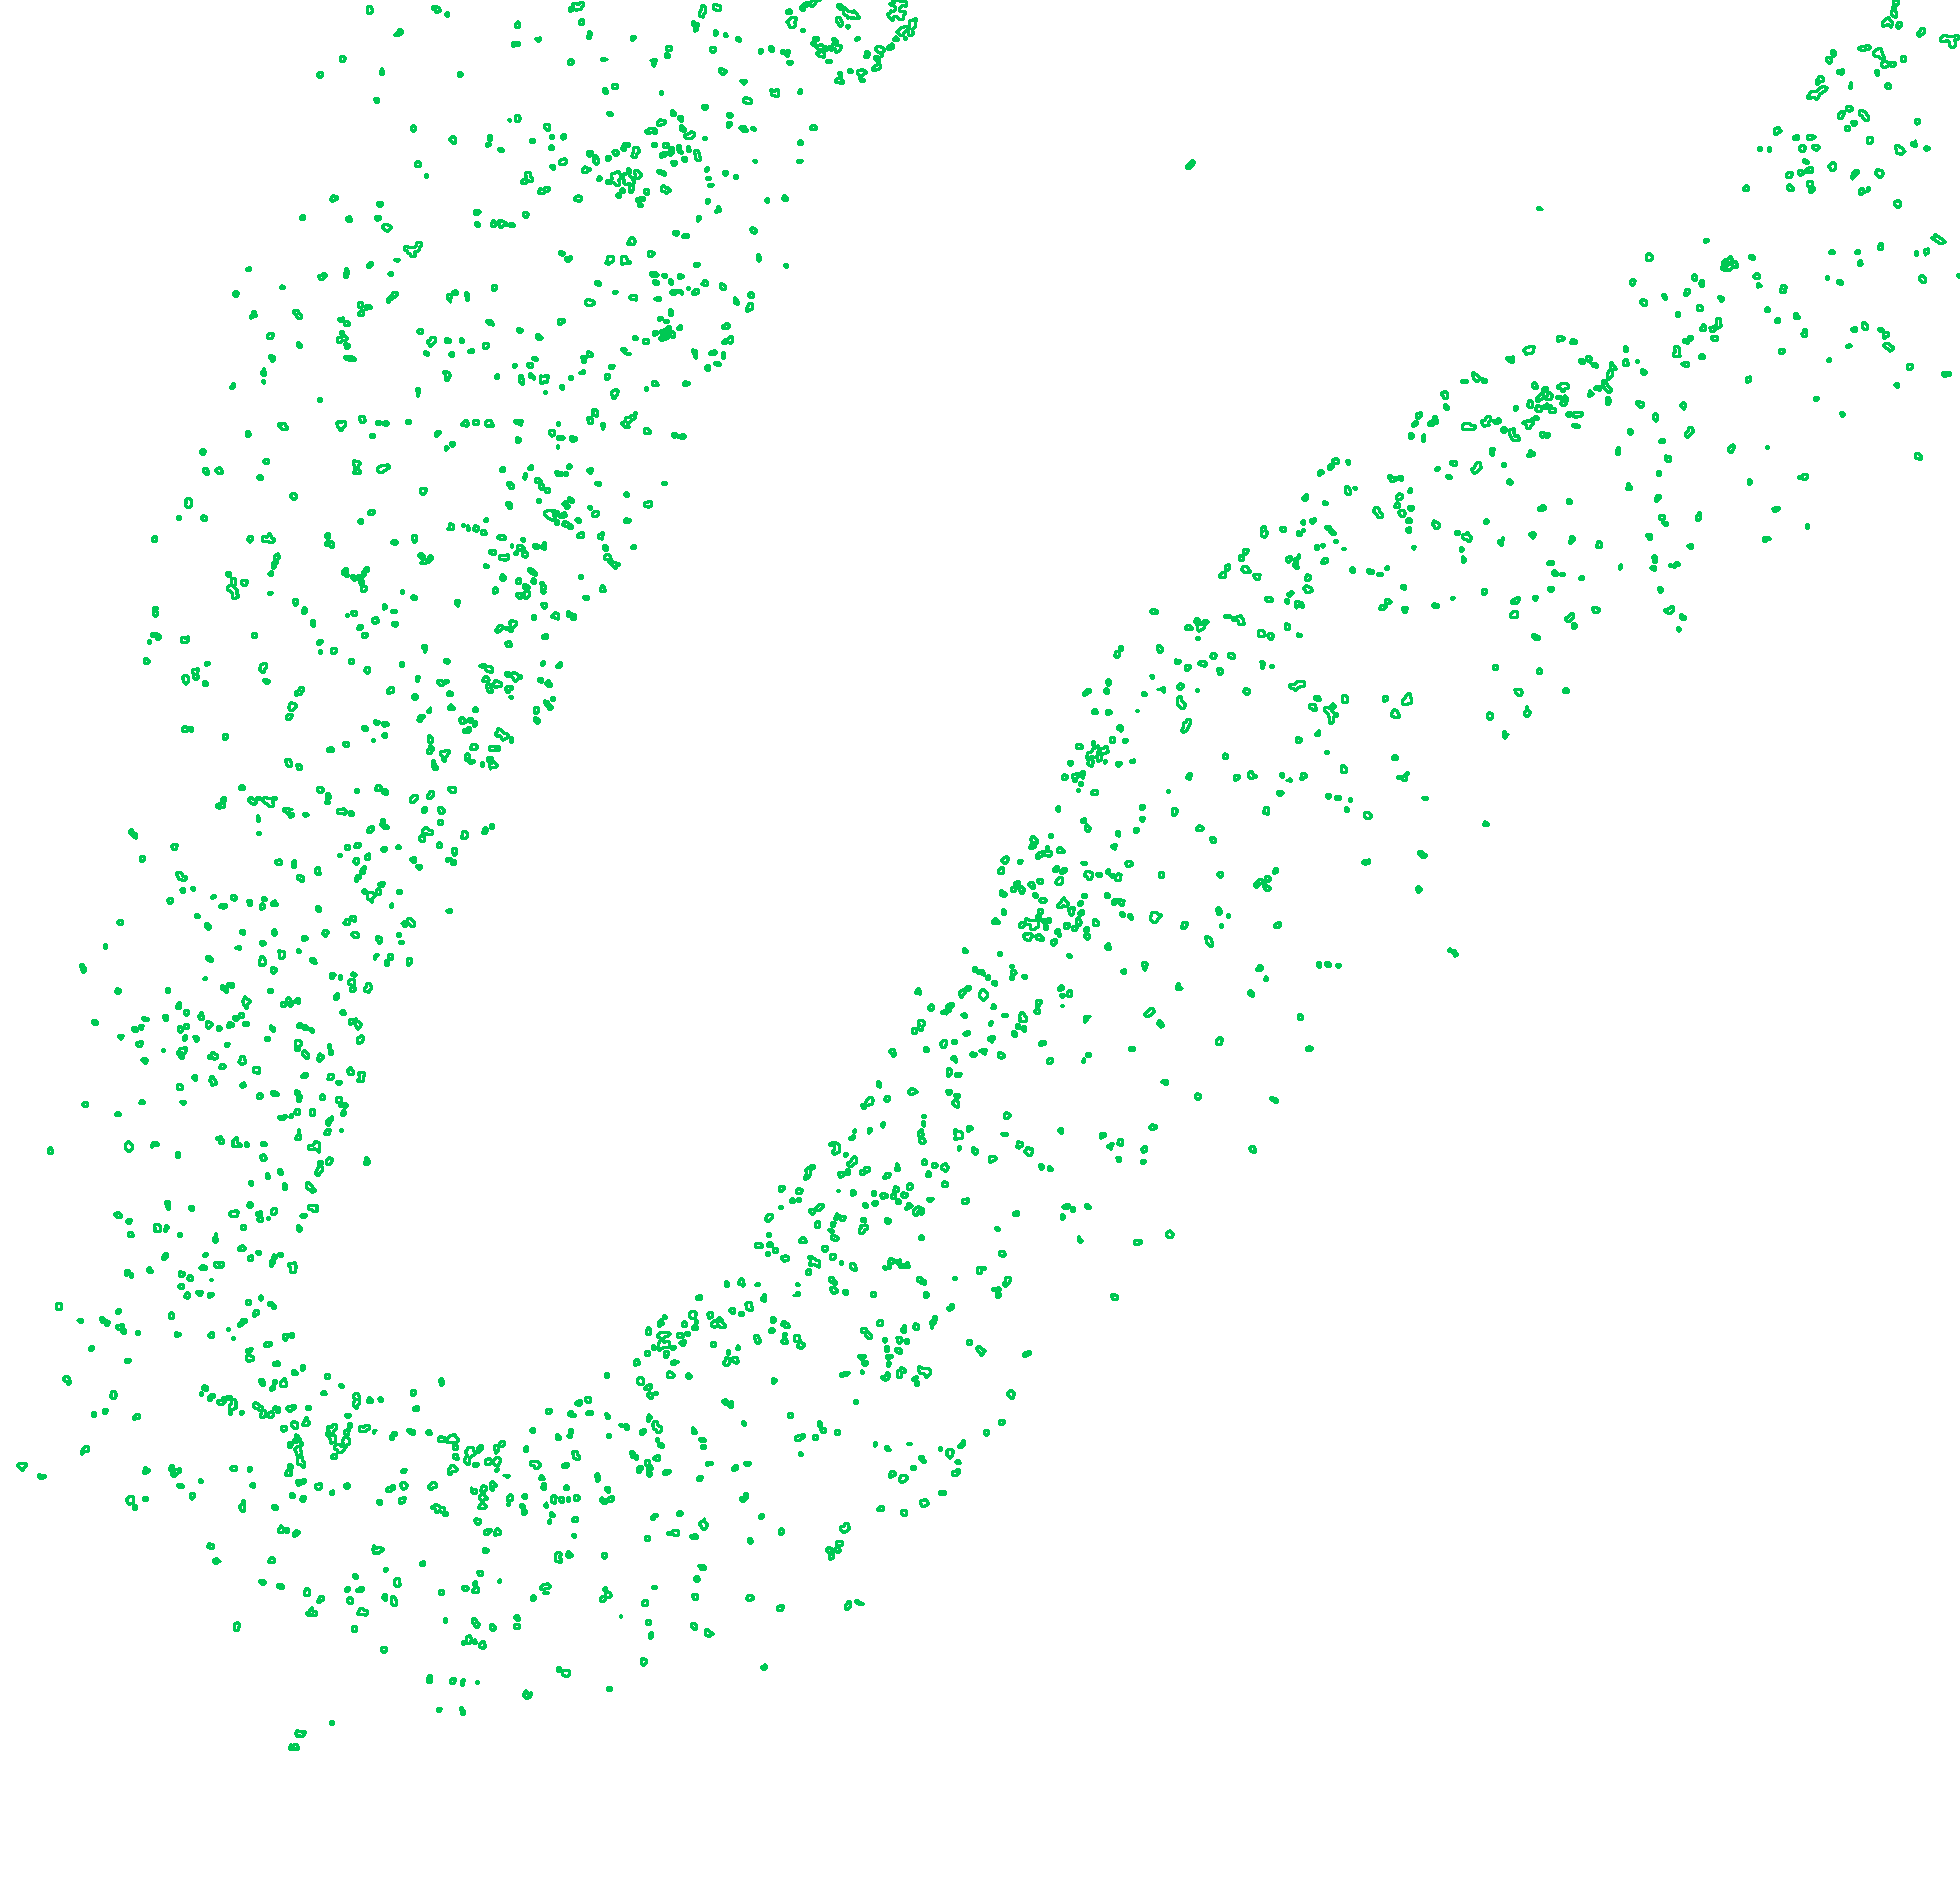

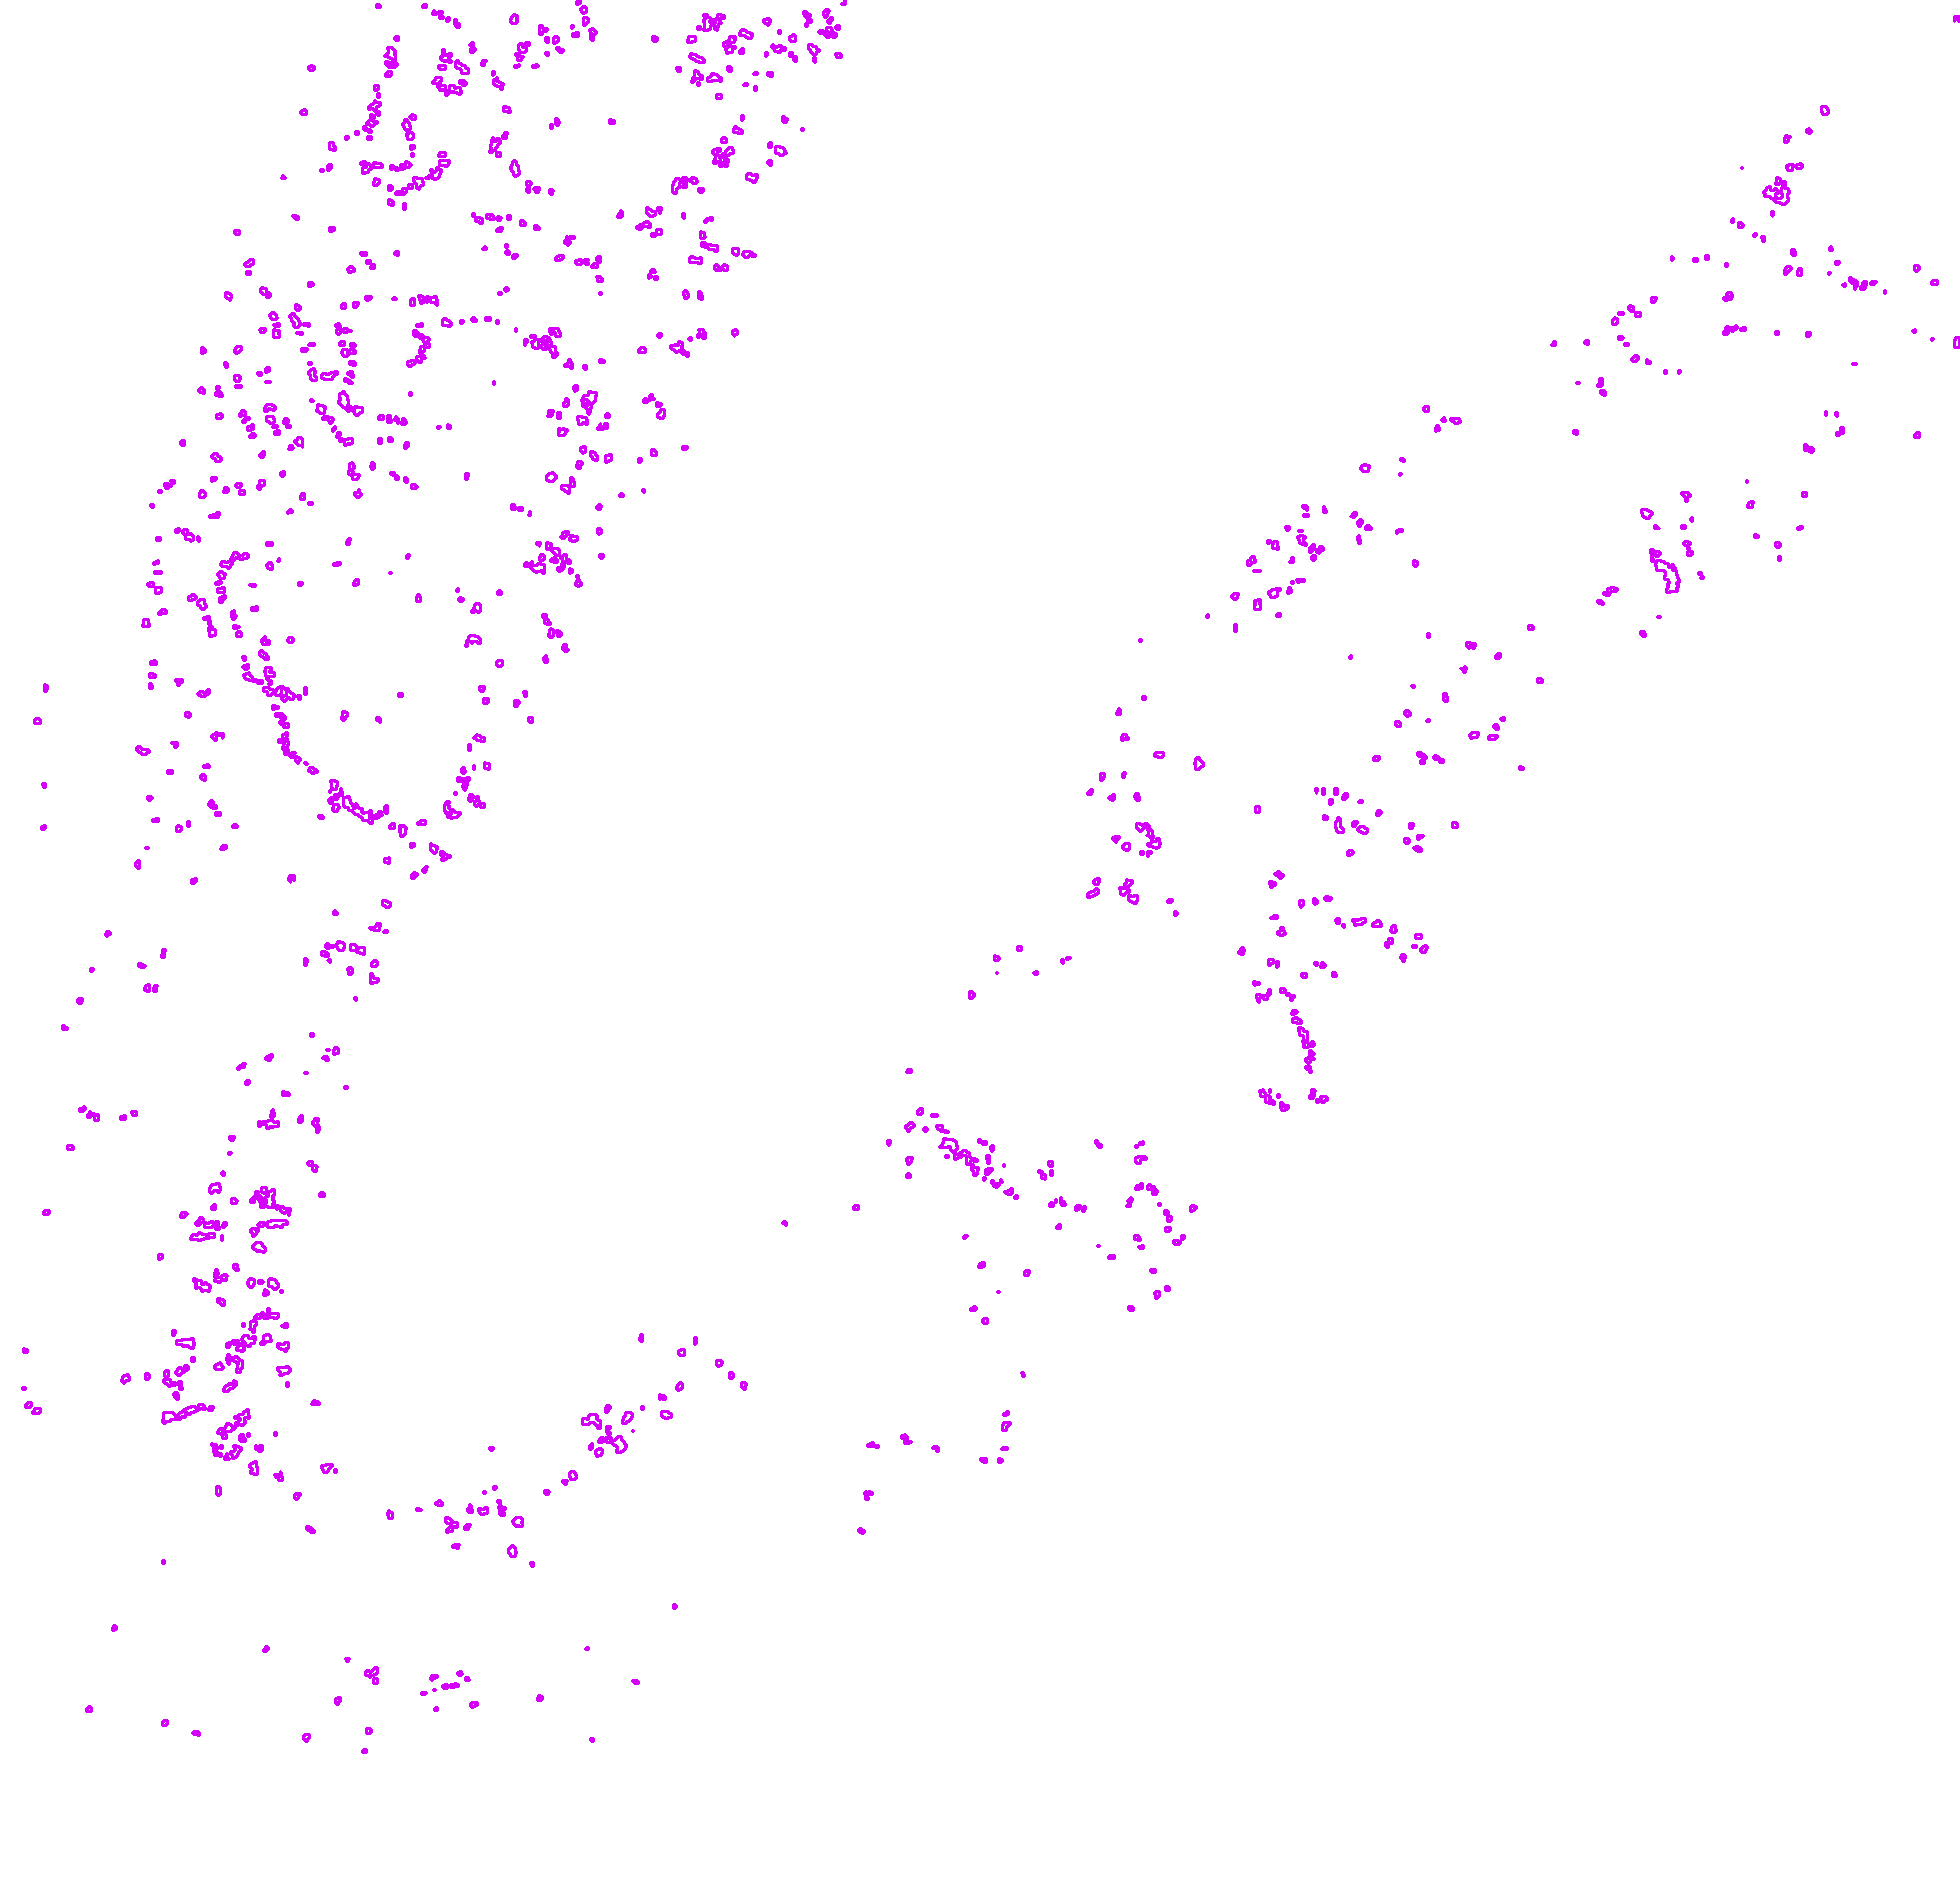
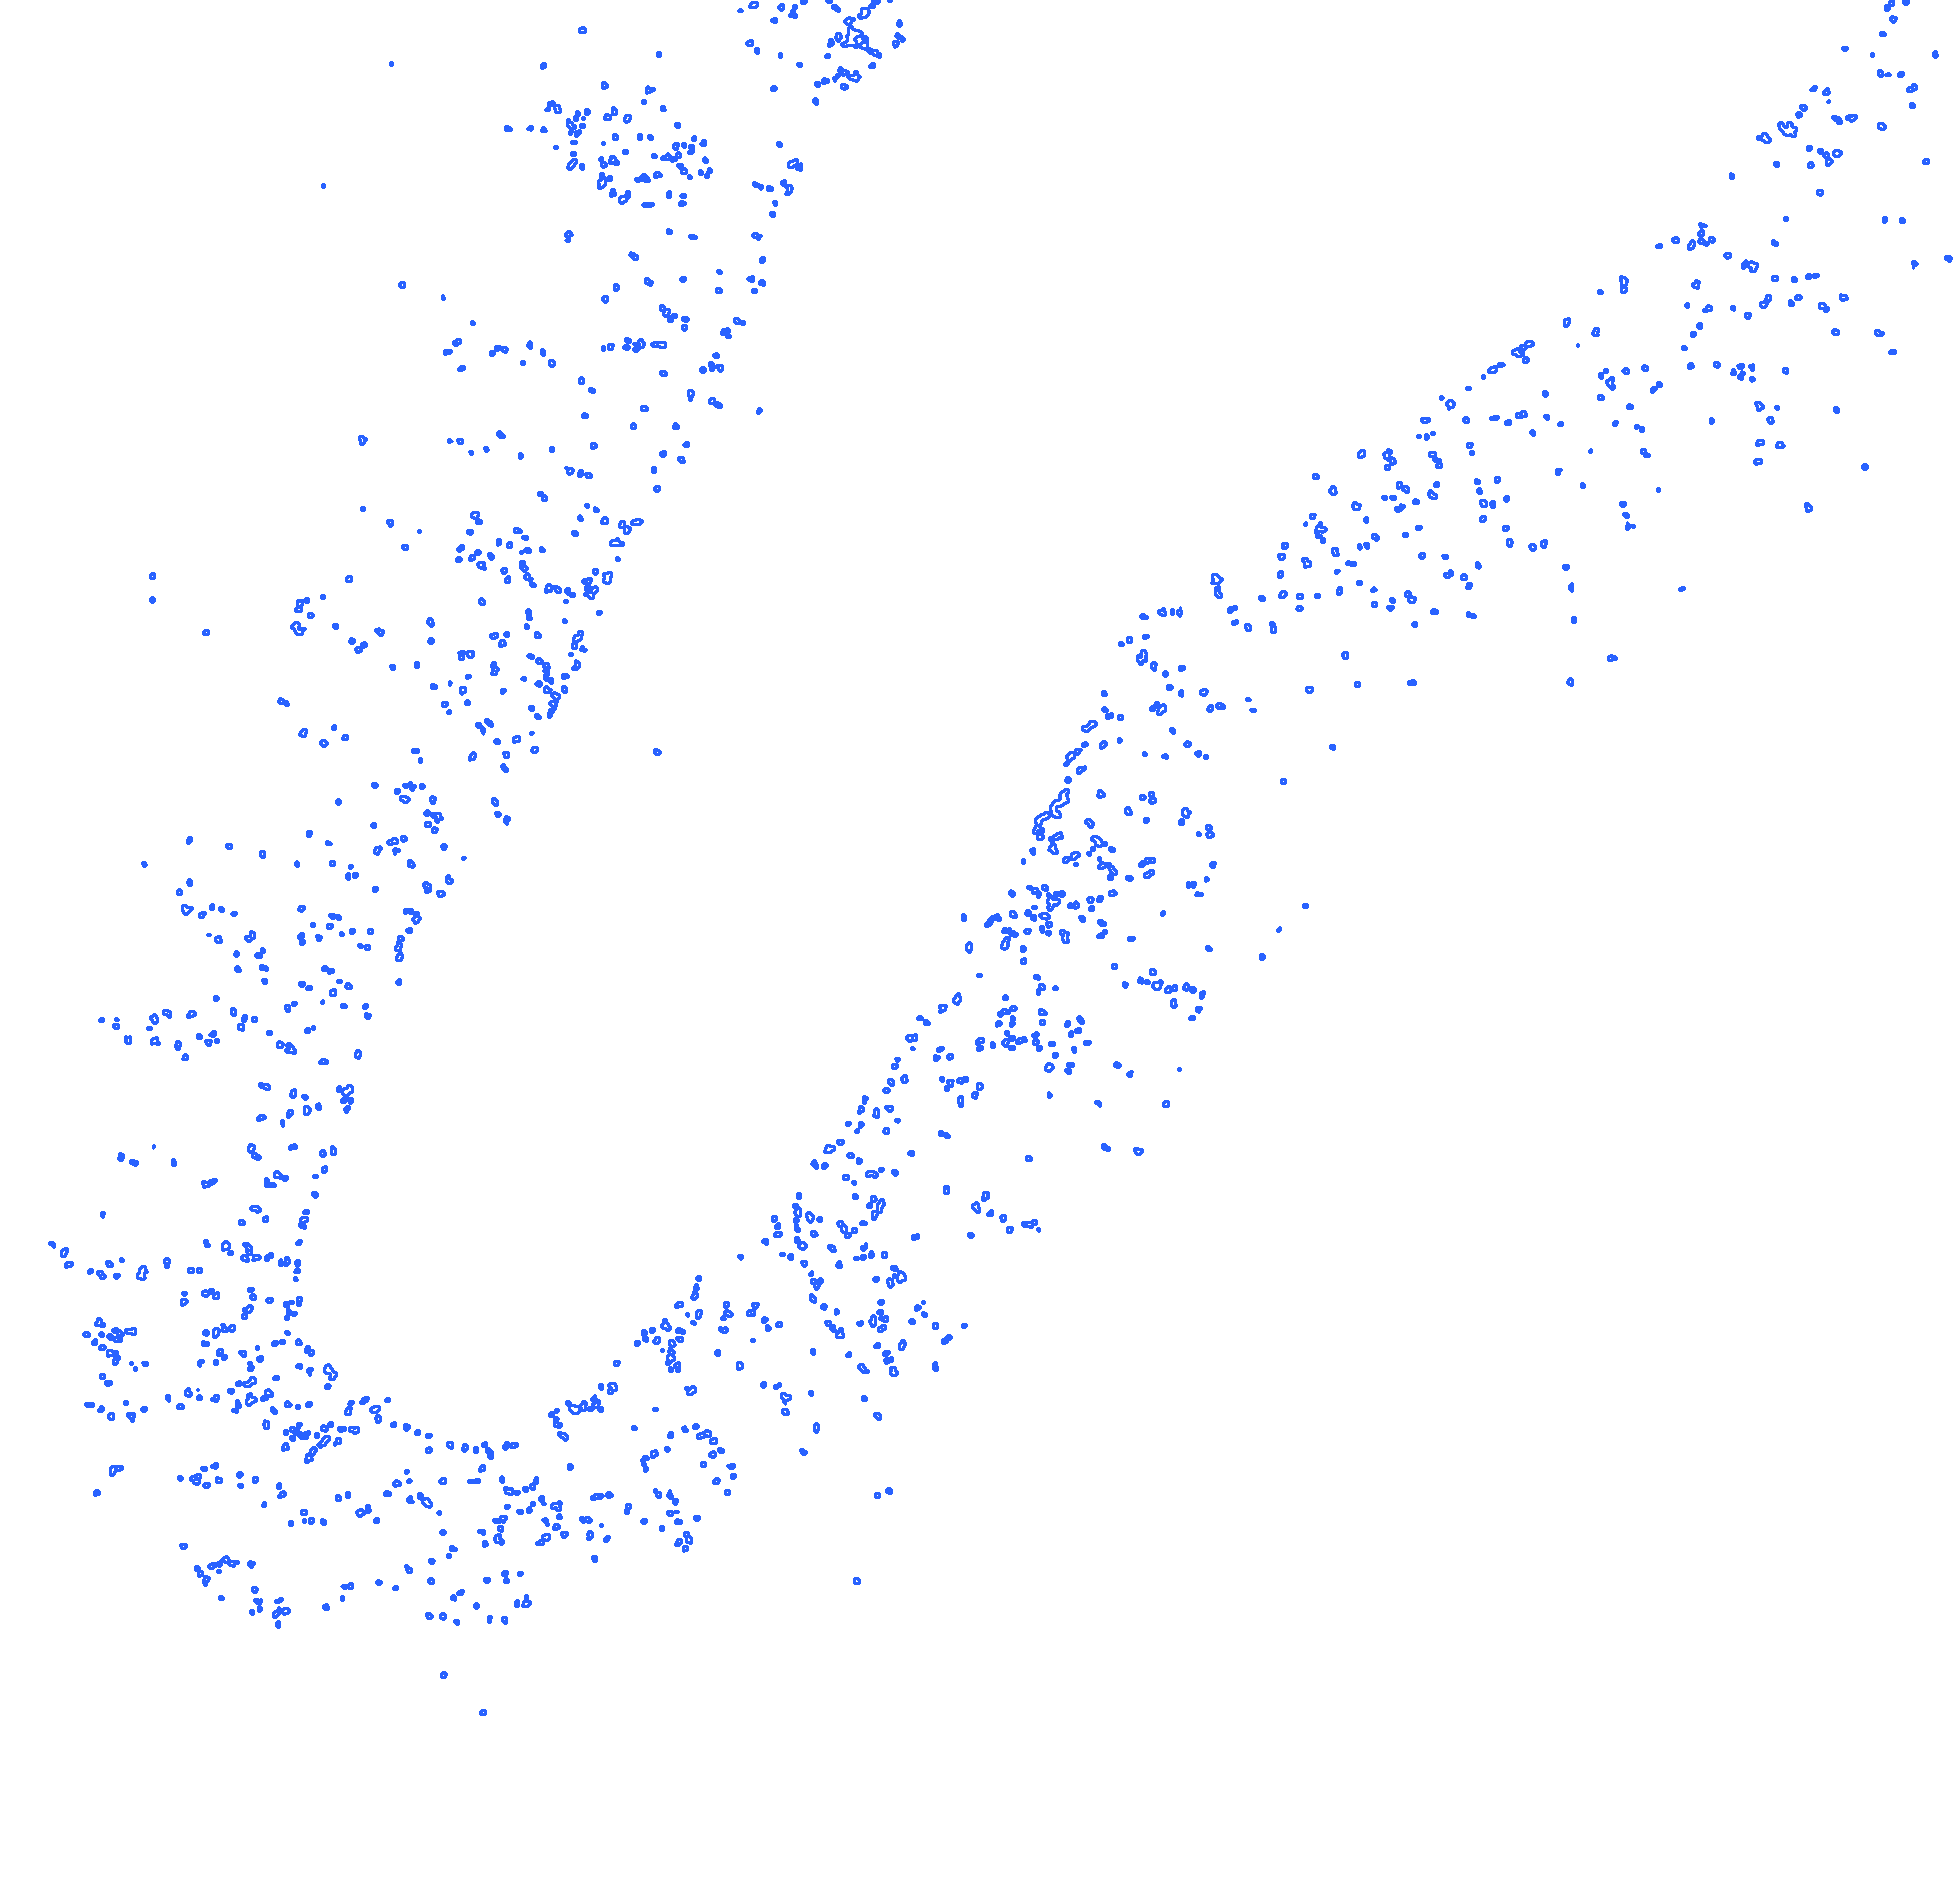
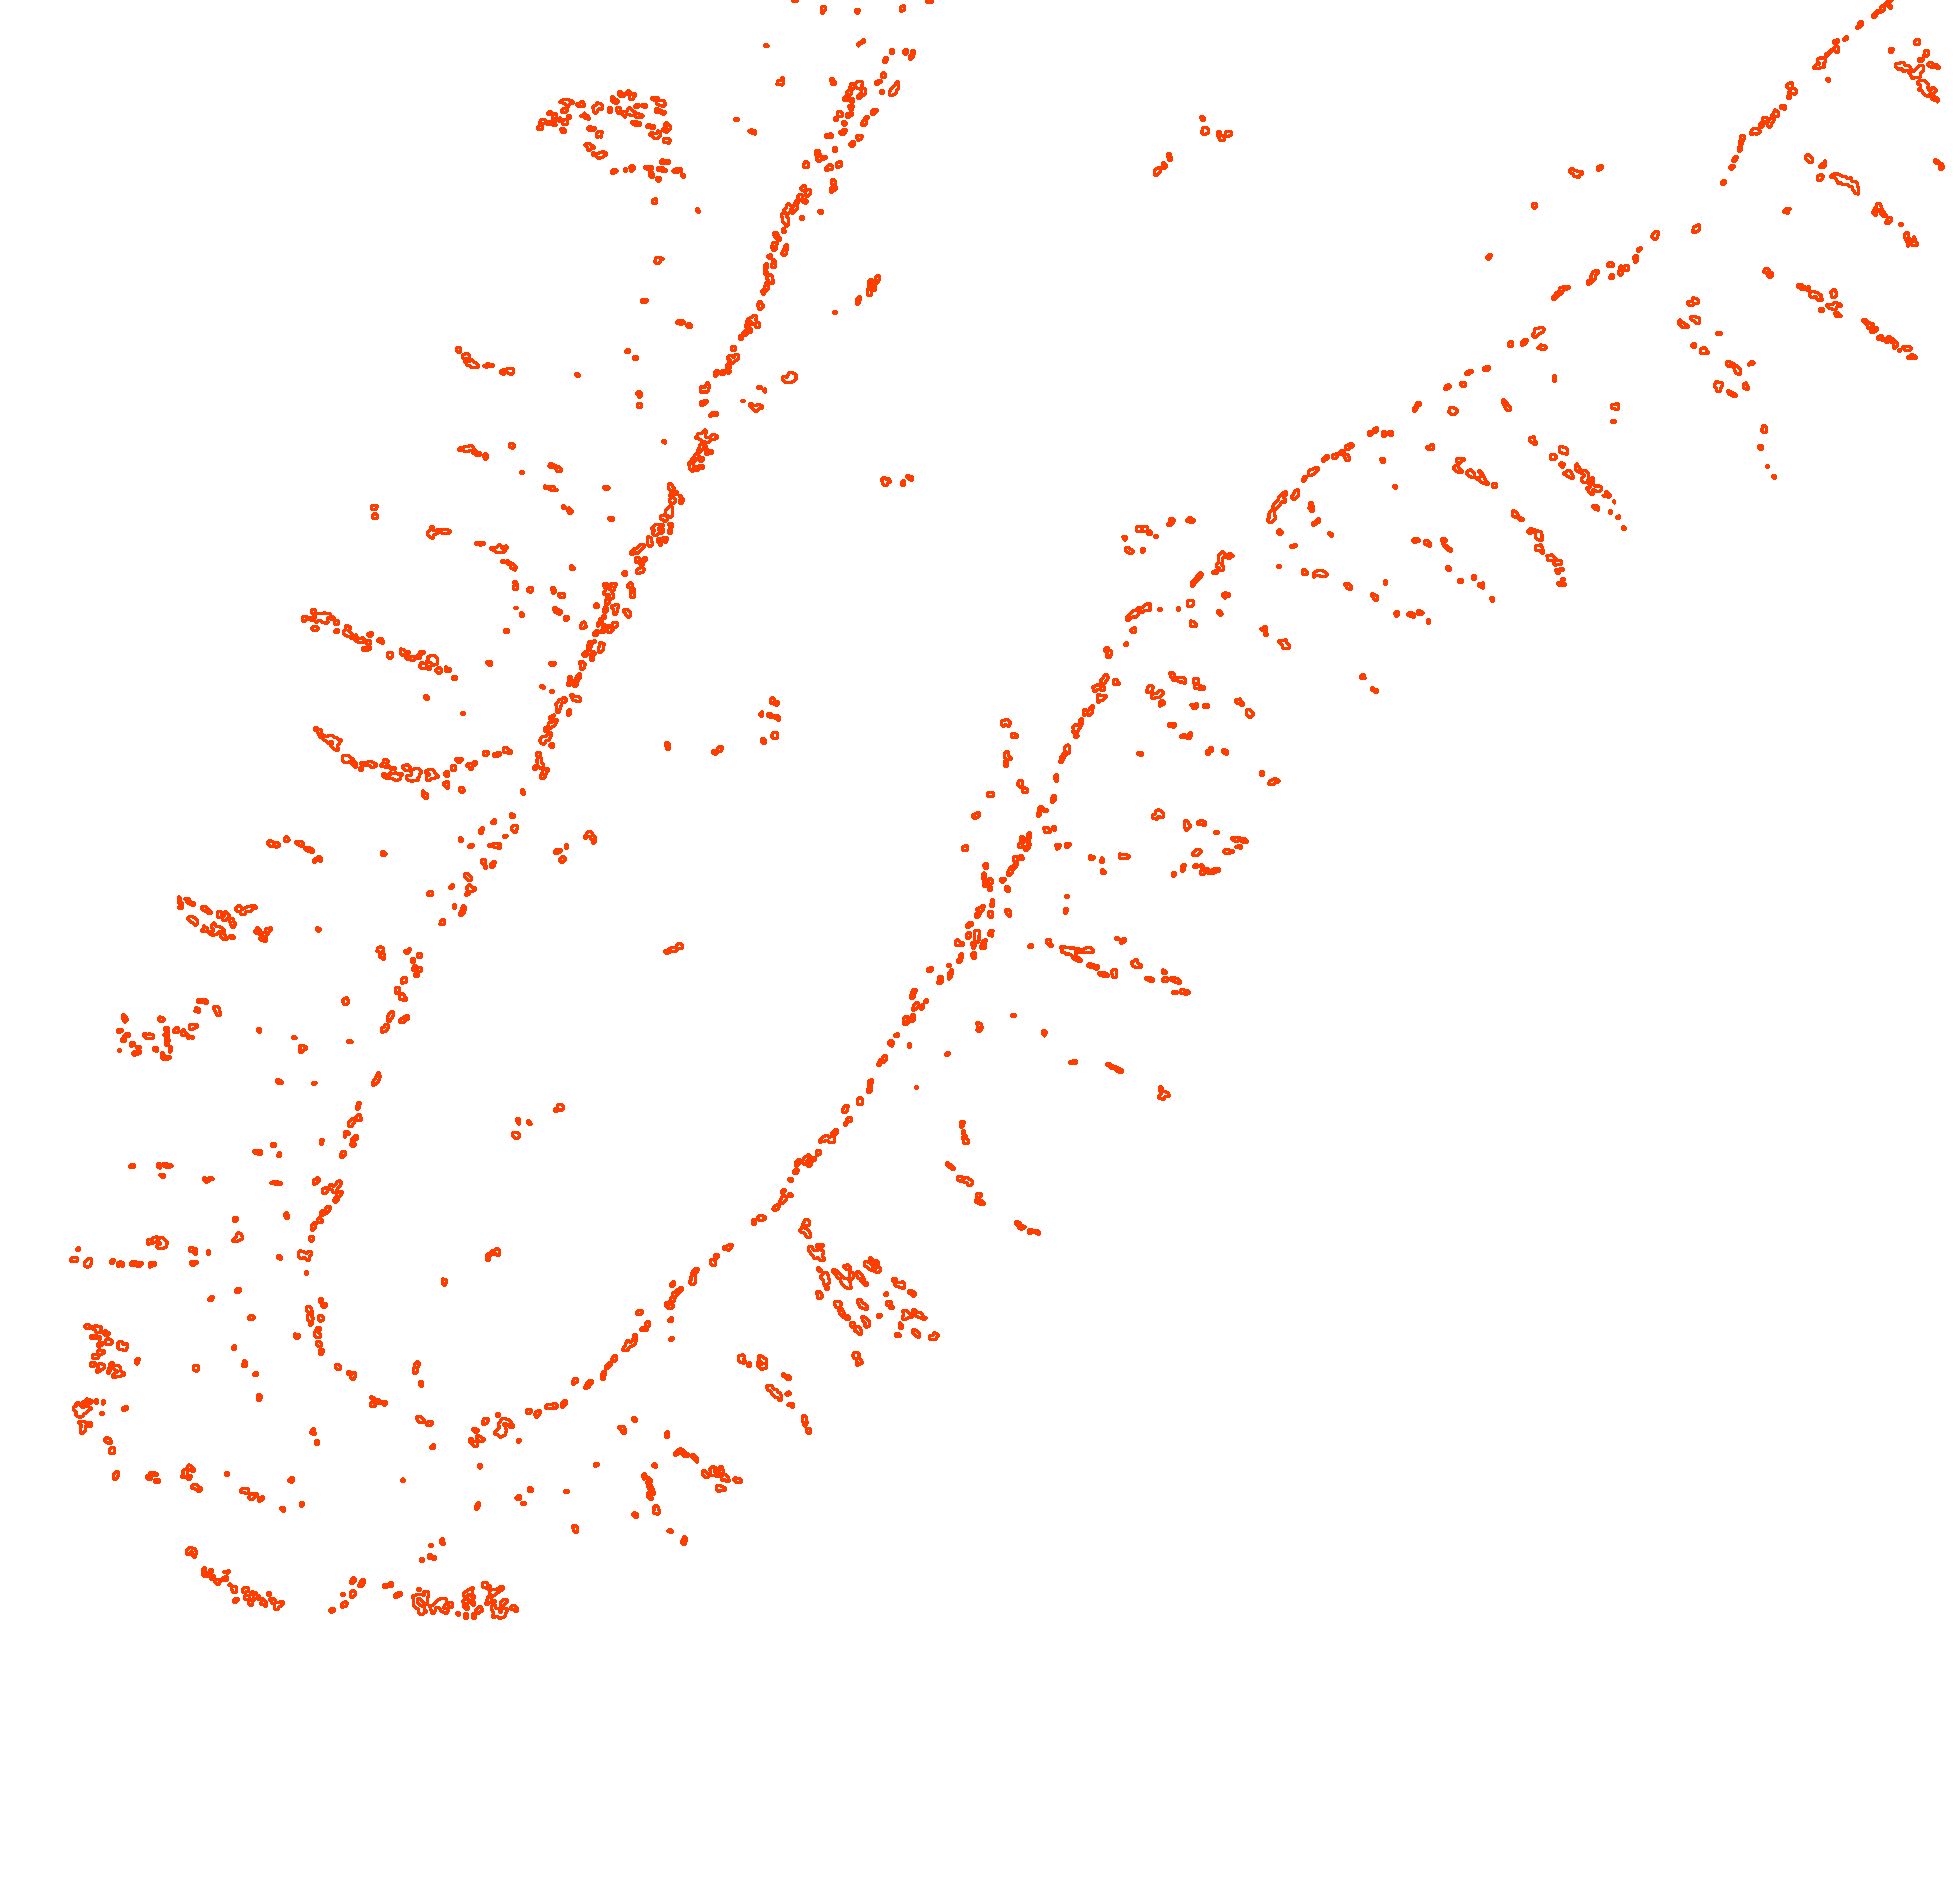

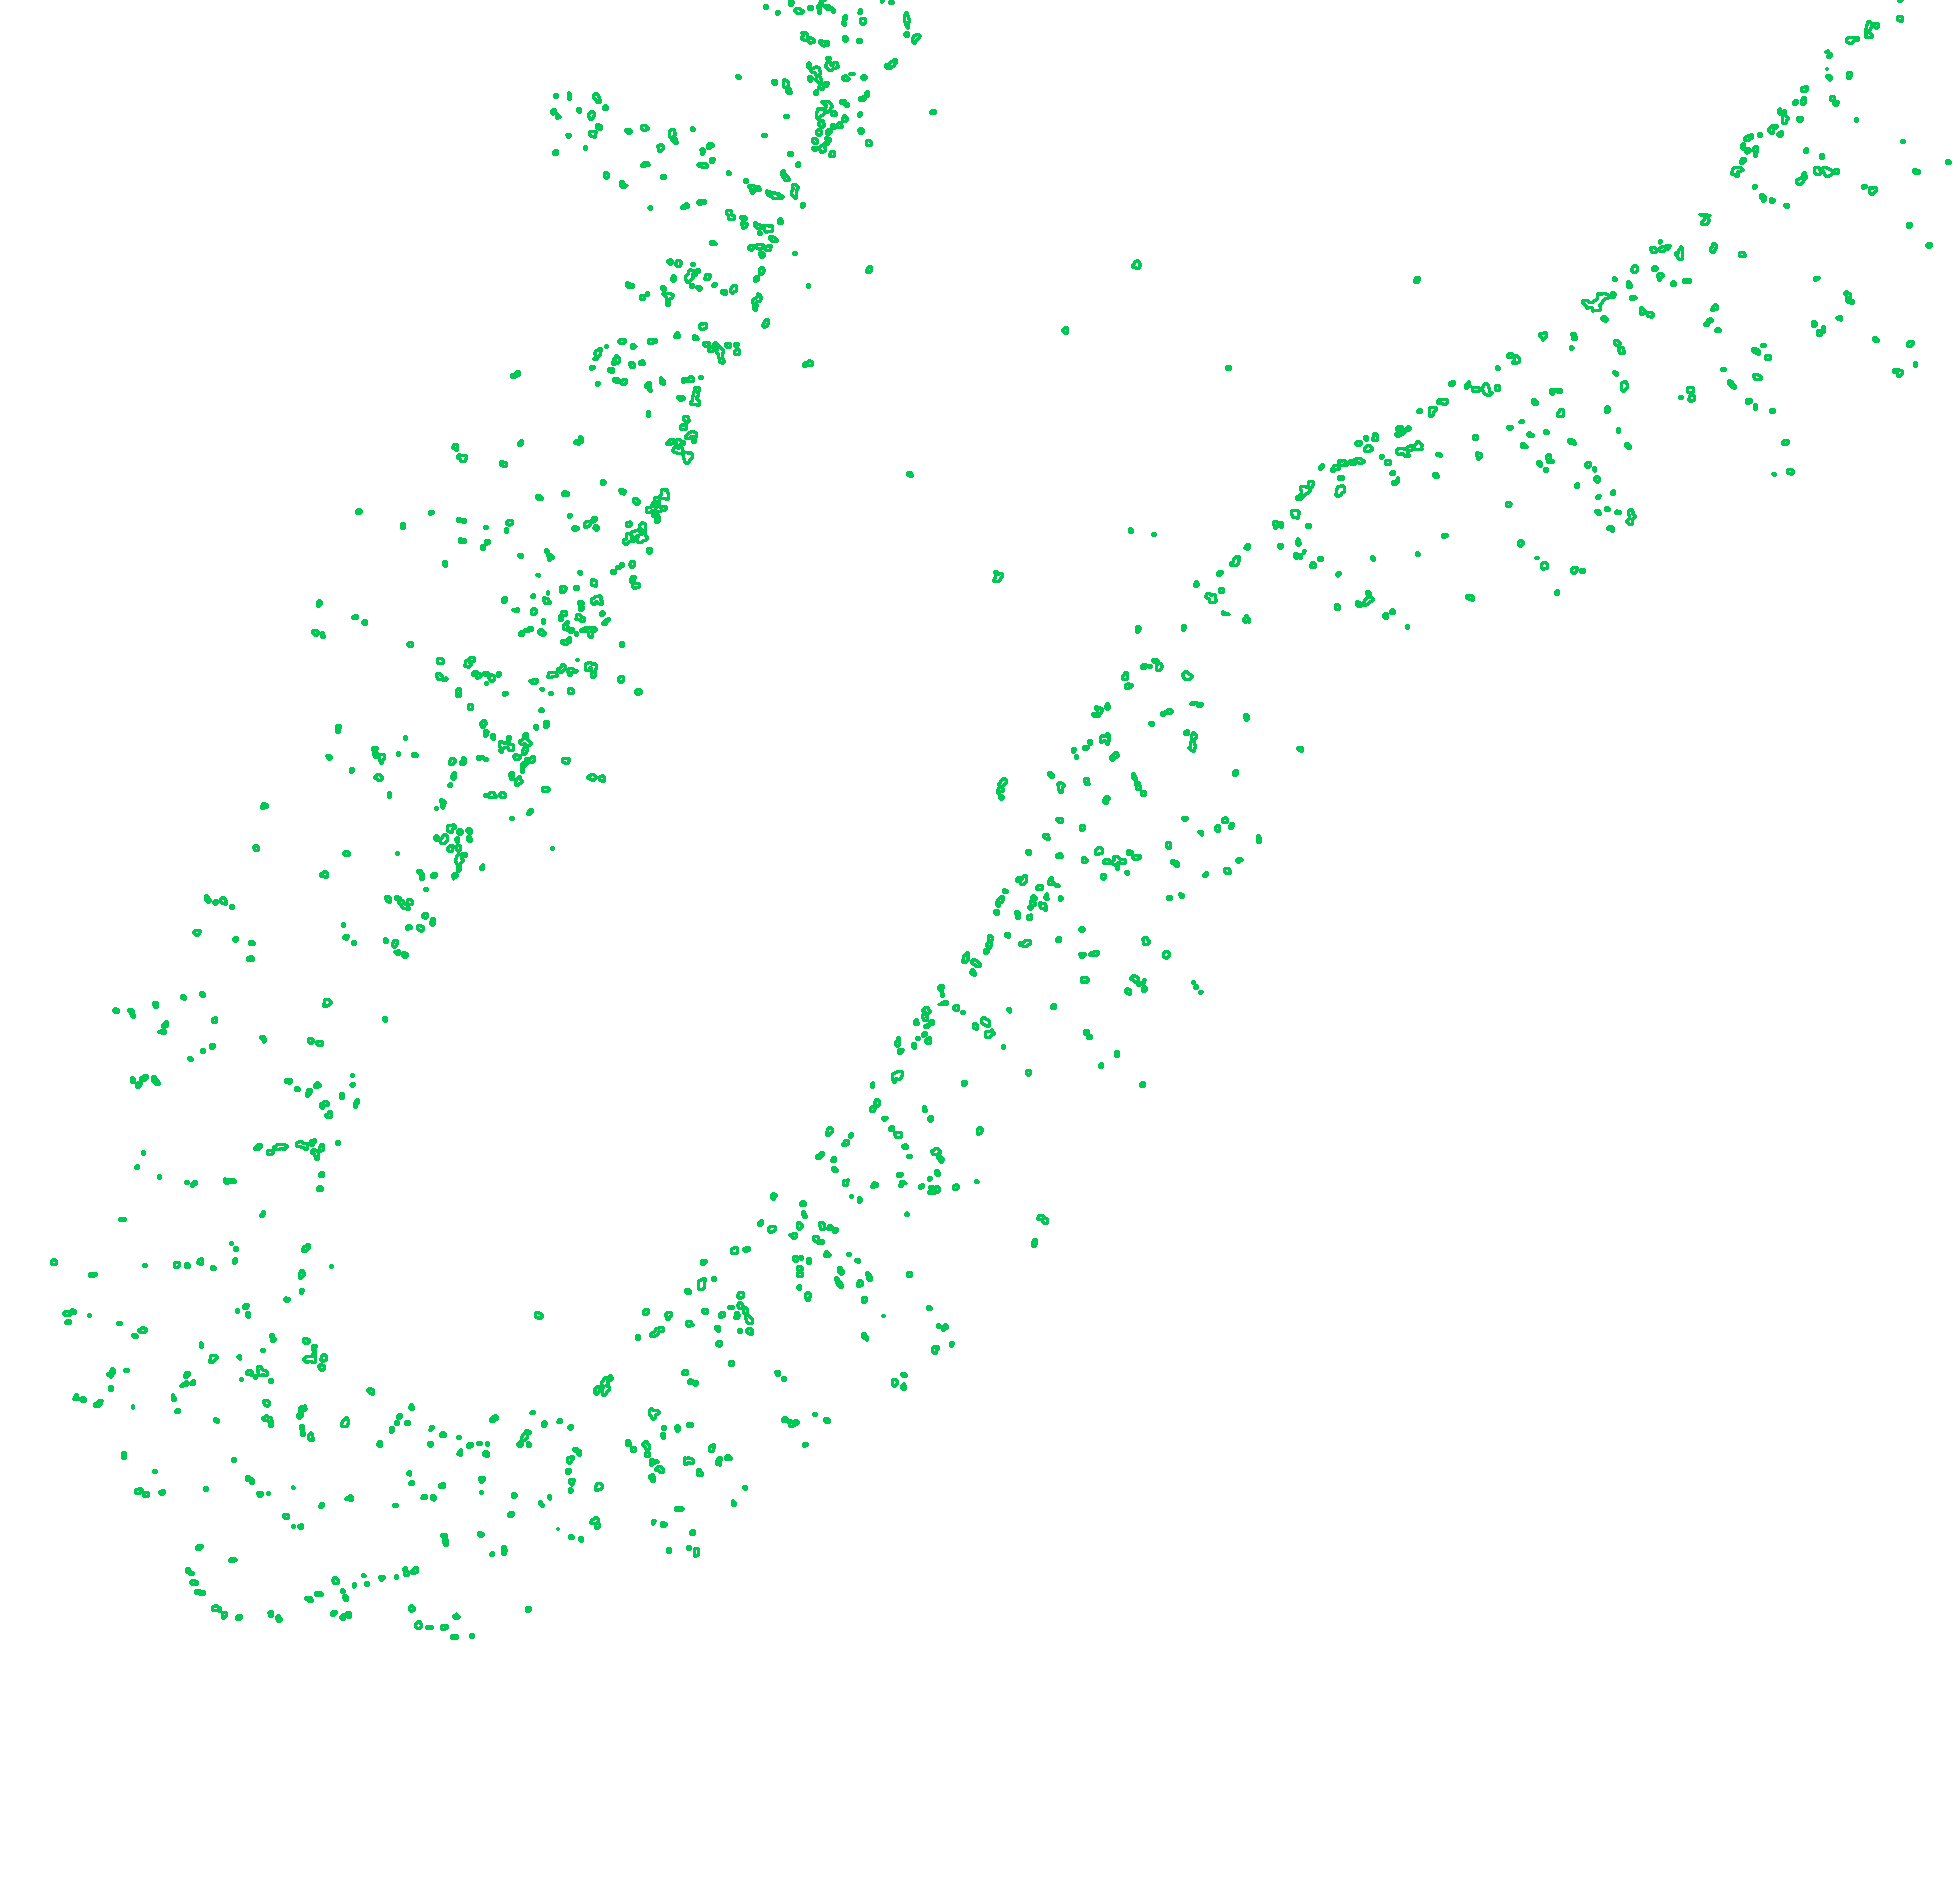

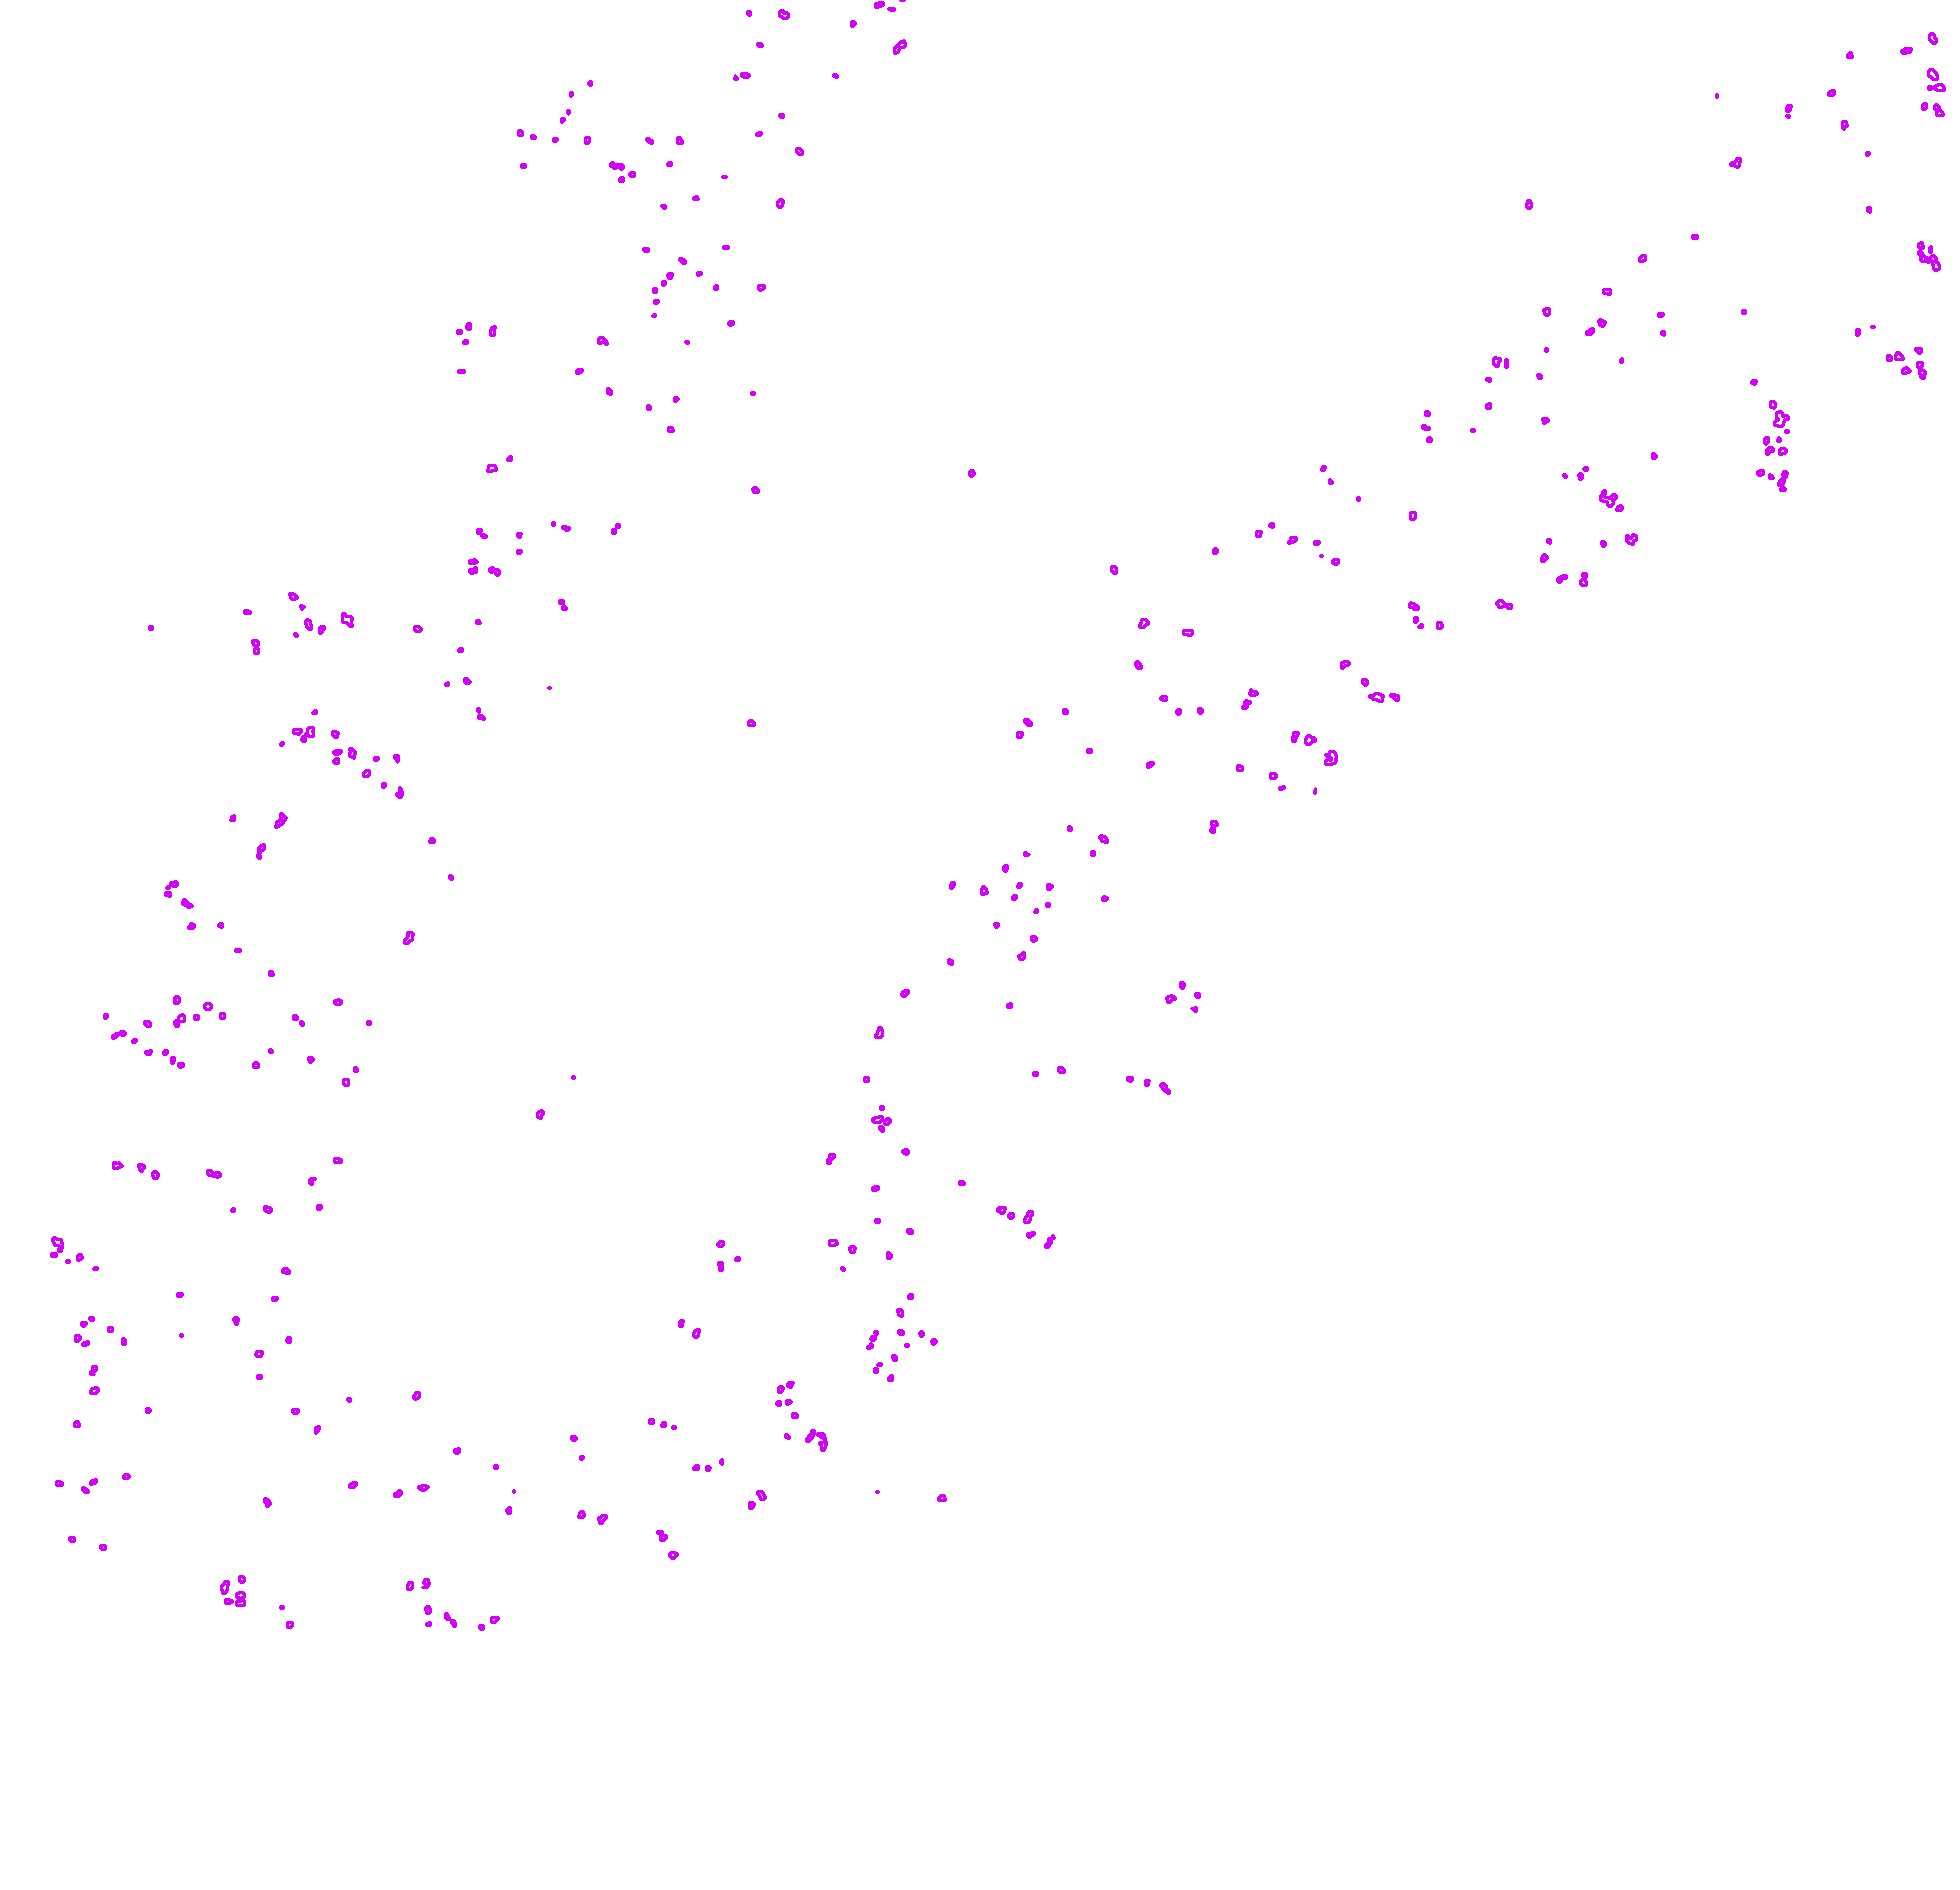

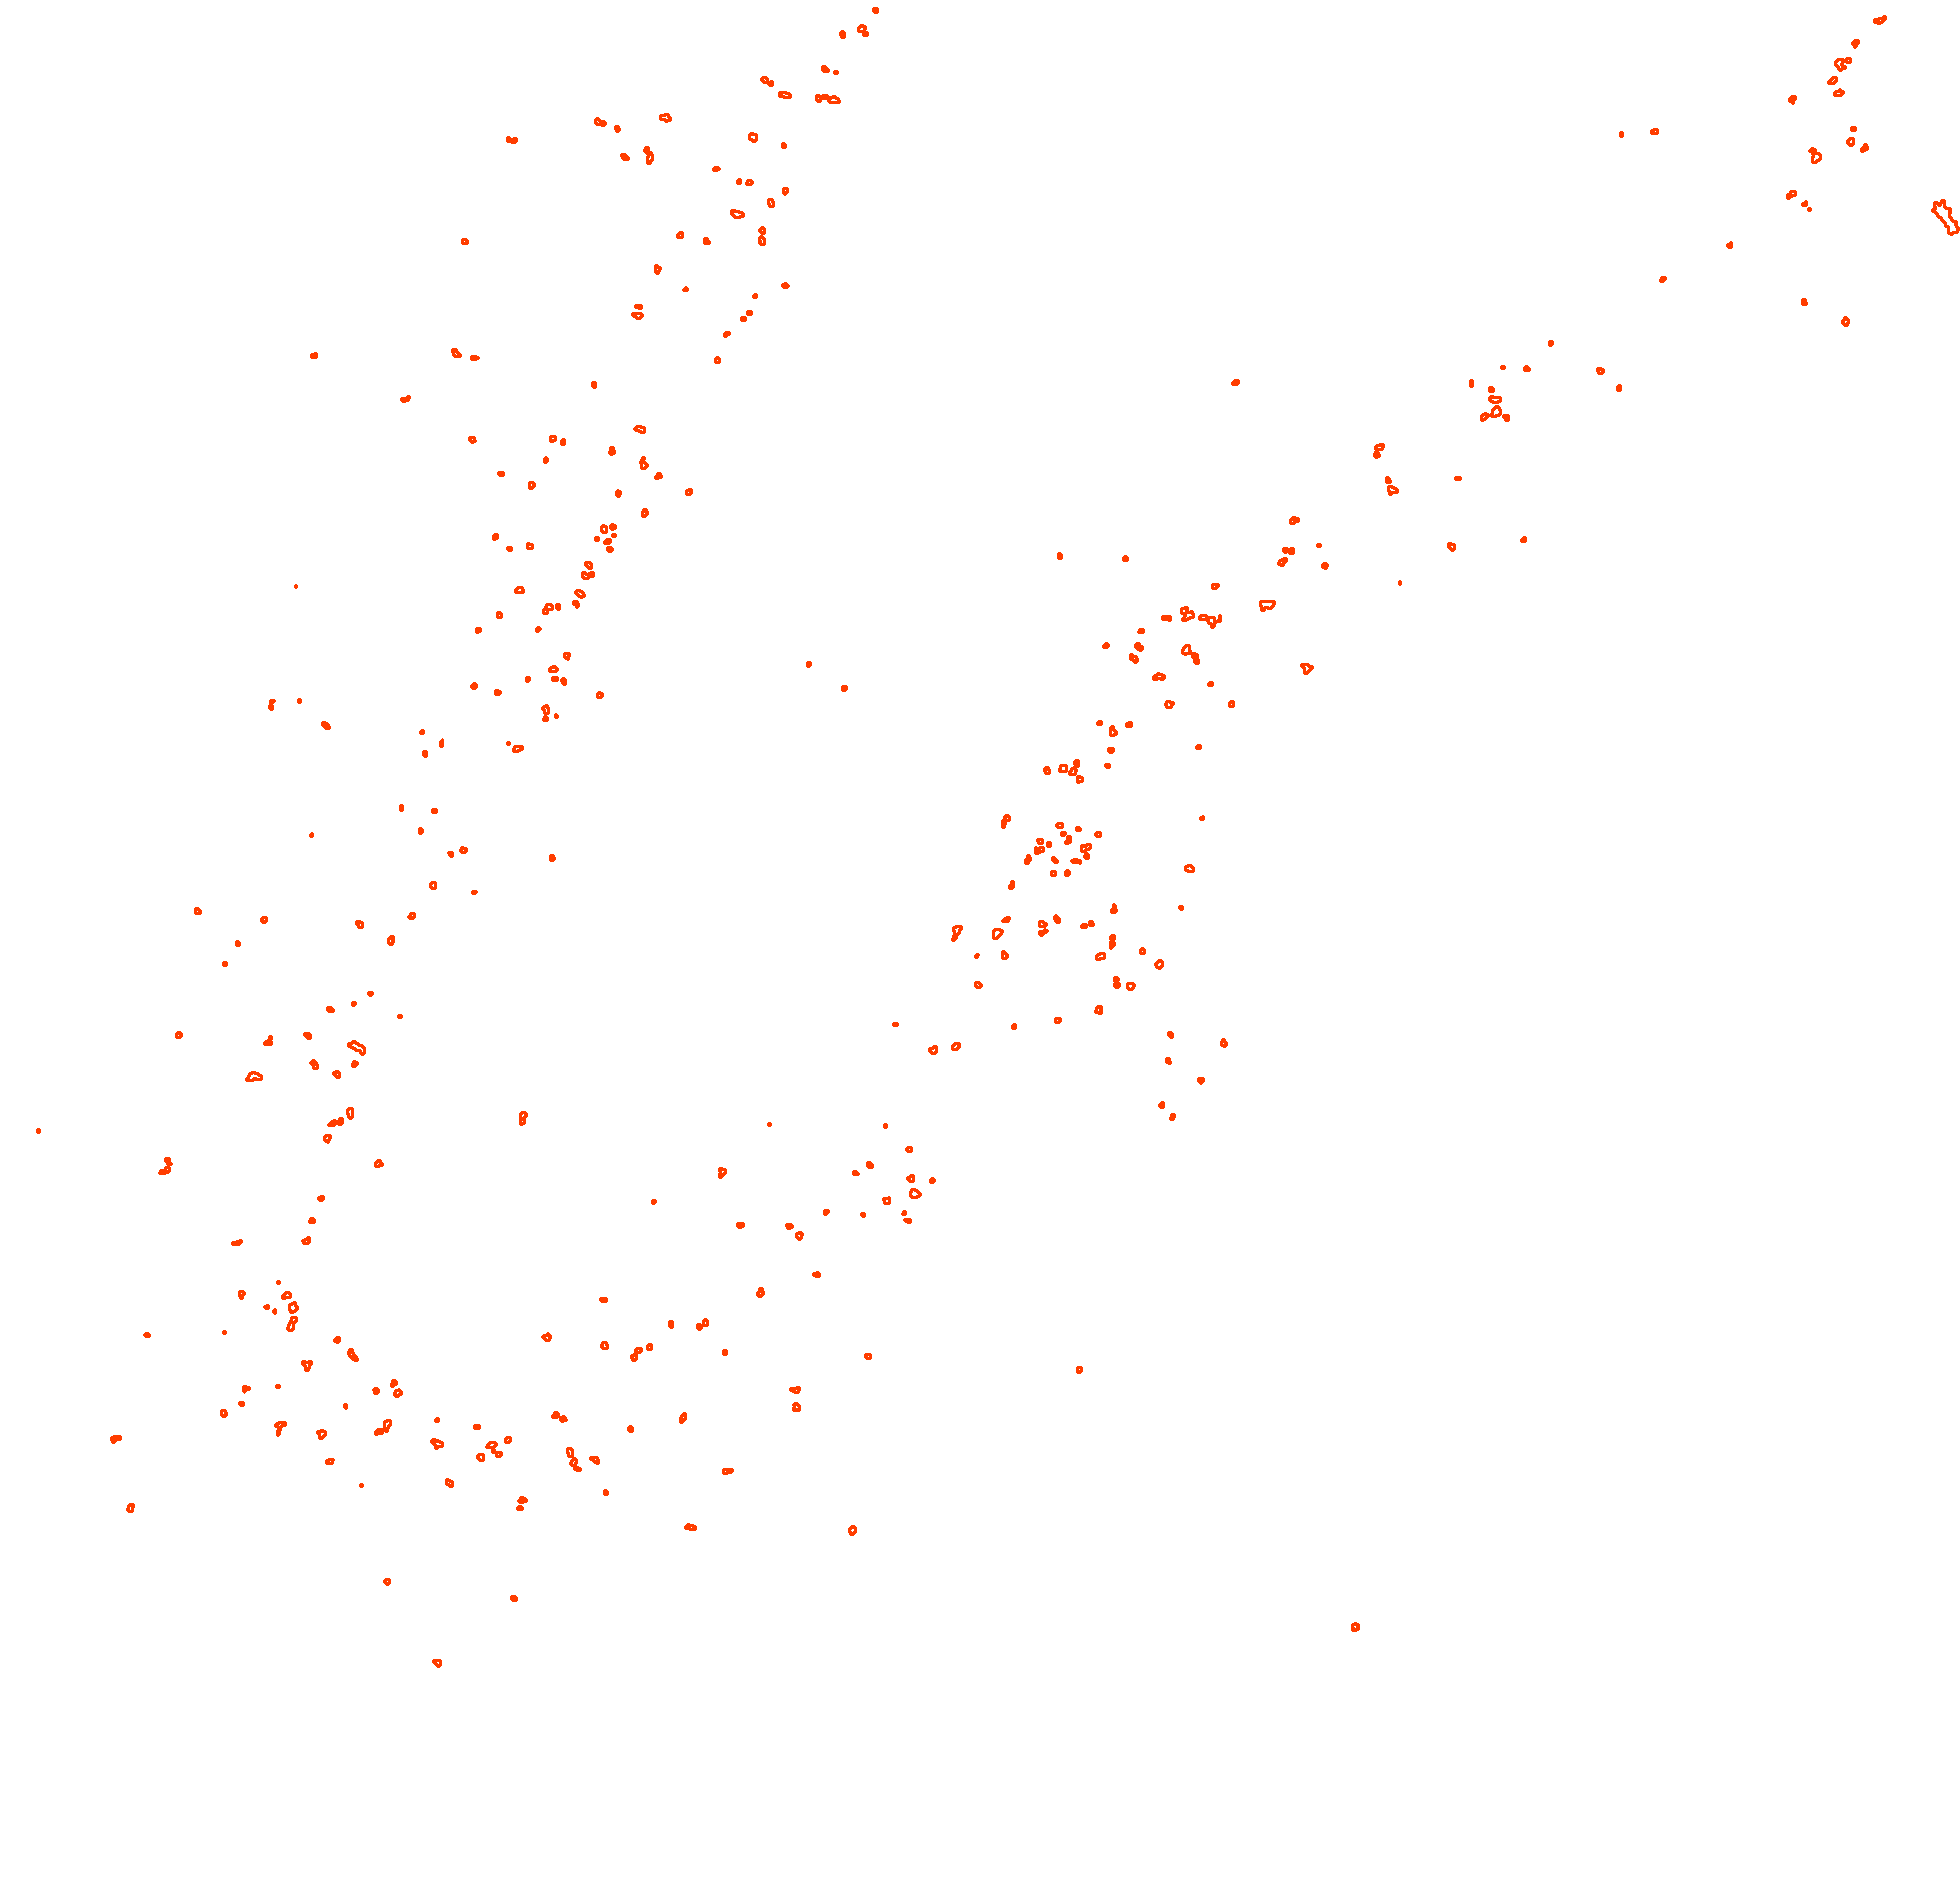





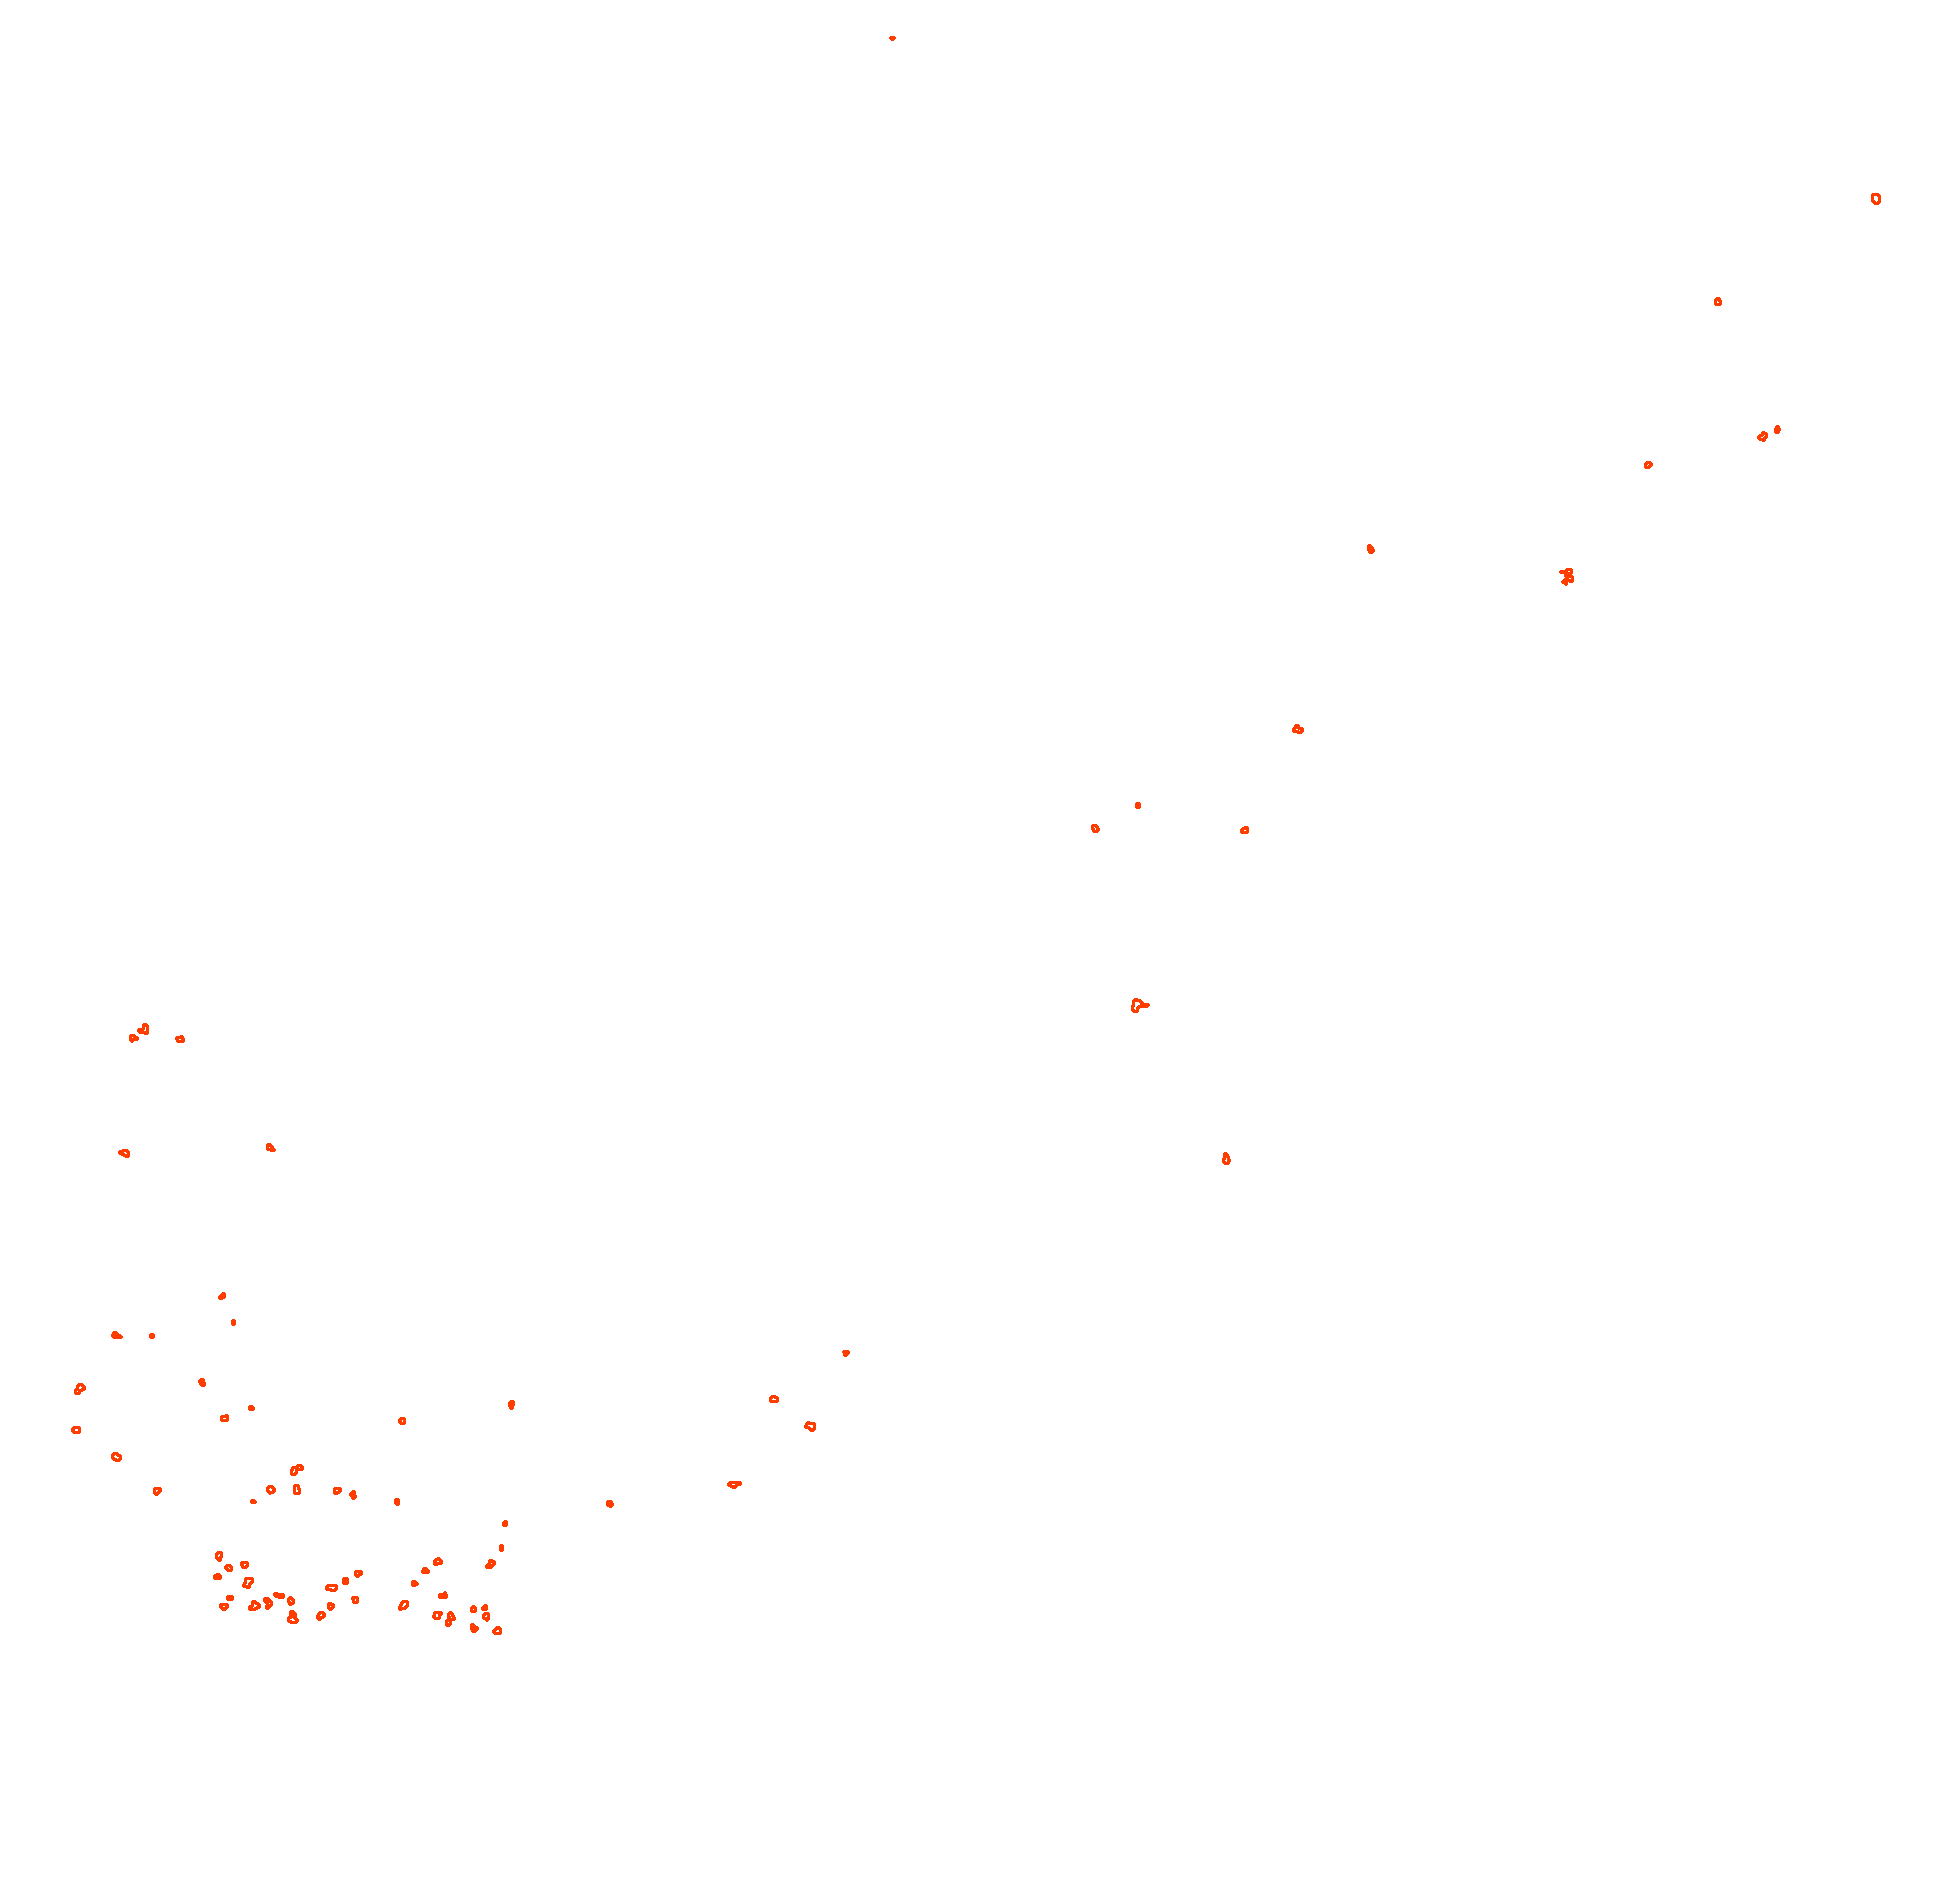

Human duodenum, donor B004, CODEX with 58 markers. Slide: Hickey et al., Nature 2023, CC0.
A real run · Flow cytometry, CAR-T
CAR+ T cells in blood after axi-cel, gated against FMO controls.
The request
“These are blood samples from lymphoma patients after axi-cel, a CD19 CAR-T. The CAR is stained in the CAR channel. Use the FMO files in the batch to place each gate. Gate single, live, dump-negative CD45+ CD3+ T cells, then split CD4 and CD8. Report the percent CAR+ among CD3, CD4 and CD8 T cells, and the CD4 to CD8 ratio inside CAR+ cells. Show me every gate.”
What came back, in 10 minutes
- 31.6%
- of T cells are CAR+, 34,218 events.
- 10.1%
- of CD8+ T cells are CAR+.
- 22.8%
- of CAR+ CD4 T cells are Helios+, asked for later in the same chat.
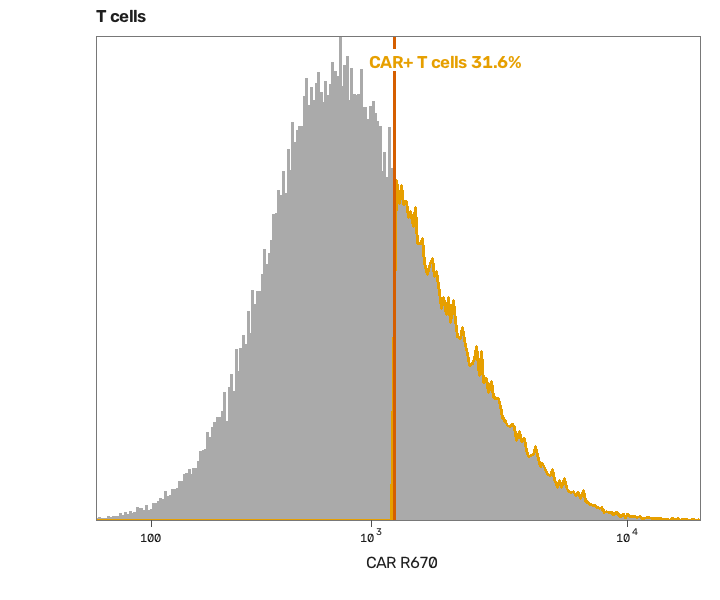
CAR+ T cells
The CAR cut, placed from the CAR FMO file.
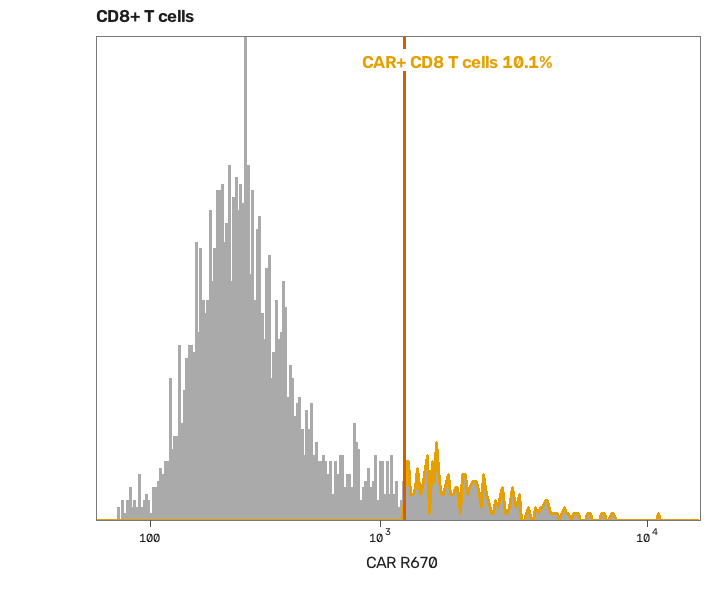
CAR+ CD8 T cells
The same cut inside the CD8 T cells.
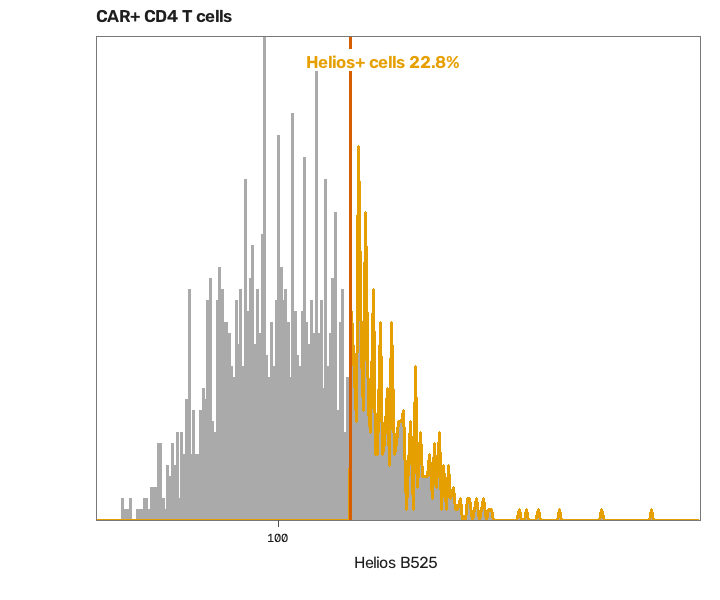
Helios on CAR+ CD4 T cells
Cut from its own FMO, to look for CAR+ regulatory T cells.
What it flagged for a person to check
- CAR does not form two peaks; share depends on the FMO cut
- CD8 has no FMO; very few CD8+ T cells
- No CD25 FMO; CD25 line passes below every CAR+ CD4 cell
Blood of a patient 7 days after axi-cel, fluorescence flow. Data: Good et al., Nature Medicine 2022, ODC-PDDL.
A real run · Mass cytometry, CAR-T
Exhaustion and memory on CAR+ T cells, by mass cytometry.
The request
“Gate single live cells, then CD3+ T cells, then CD4 and CD8. Report the percent CAR+ in each. Inside CAR+ CD4 and CAR+ CD8 cells, report the percent positive for PD-1, TIM-3, LAG-3, TIGIT and CD39, and the CCR7 and CD45RA memory subsets. Show every gate.”
What came back, in 7 minutes
- 29.5%
- of CD4 T cells are CAR+, against 14.9% of CD8 T cells.
- 68.9%
- of CAR+ CD4 T cells are PD-1+, and 76.7% TIGIT+.
- 56.2%
- of CAR+ CD4 T cells are CCR7+ CD45RA+.
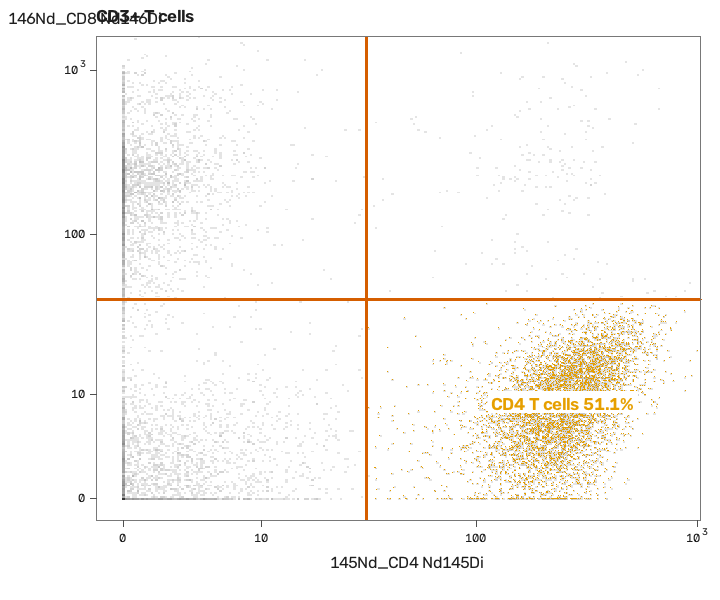
CD4 T cells
CD4 against CD8 inside the CD3+ T cells.
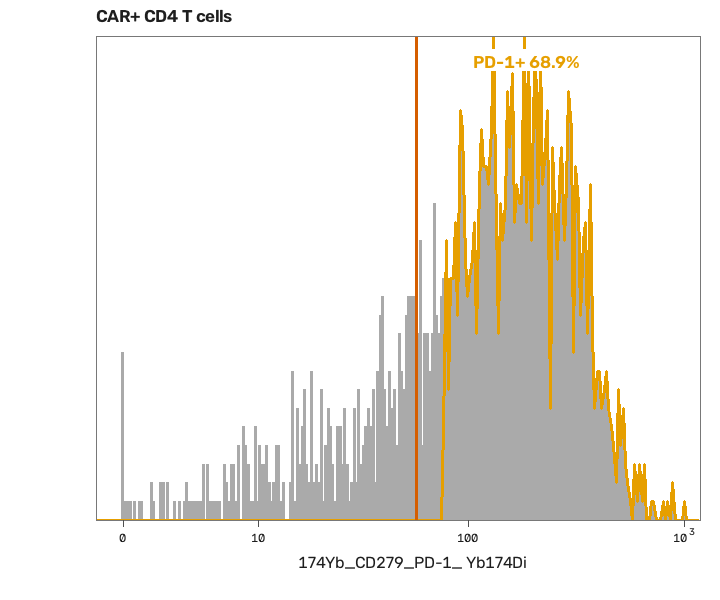
PD-1 on CAR+ CD4 T cells
One of five exhaustion markers, each cut on its own.
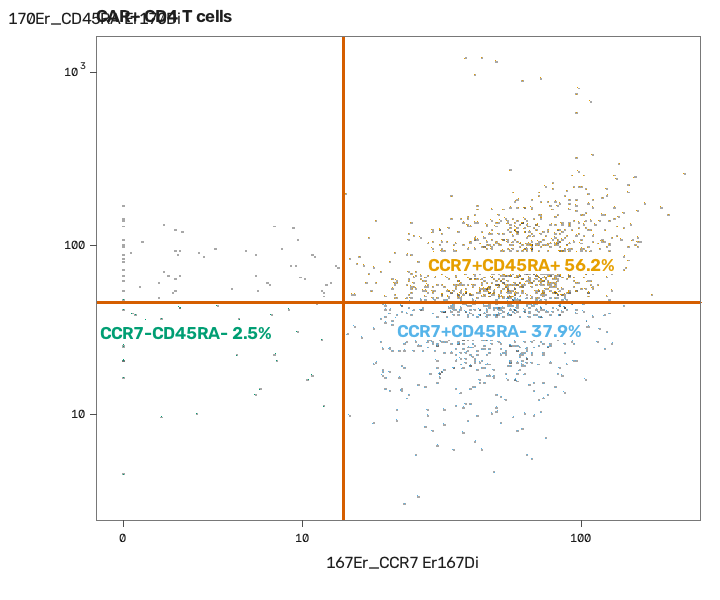
Memory subsets
CCR7 against CD45RA on CAR+ CD4 T cells, in four quarters.
What it flagged for a person to check
- CAR cut is a judgement; no FMO and no clear negative
- CCR7 and CD45RA poorly resolved; memory subsets unreliable
- Marker cuts set on this file only; MFI and cuts need a study-wide rule
Blood at peak expansion after axi-cel, CyTOF. Data: Good et al., Nature Medicine 2022, ODC-PDDL.
A real run · Flow cytometry, 8 colours
Cytokines in stimulated T cells, from an 8-colour panel.
The request
“Gate single cells, live cells, then CD3+ T cells, then CD4+ and CD8+. Report CD4+ and CD8+ as a percent of CD3+. Then, inside CD4+ and inside CD8+ T cells, report the percent positive for IFN-γ, IL-2, TNF and CD107a. Show every gate.”
What came back, in 5 minutes
- 70.0%
- of live single cells are CD3+ T cells.
- 60.8%
- of T cells are CD4+, and 32.7% are CD8+.
- 2.9%
- of CD8+ T cells make IFN-γ after stimulation.
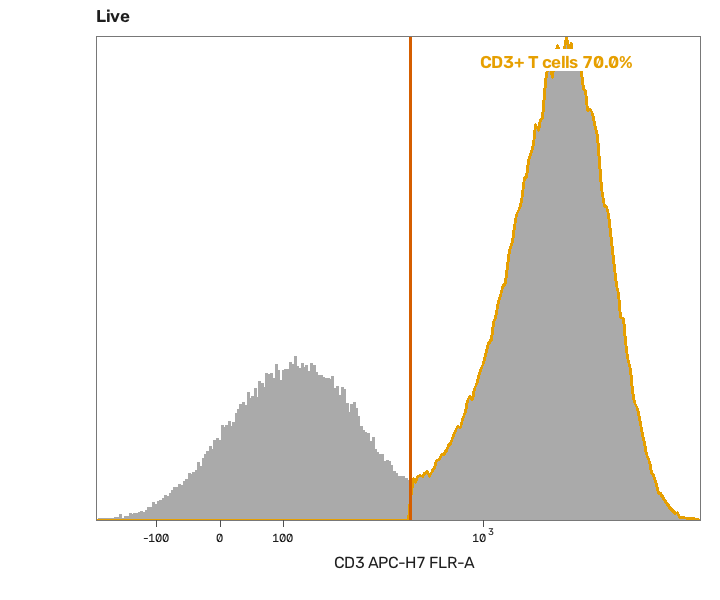
CD3+ T cells
Cut in the valley between the two peaks.
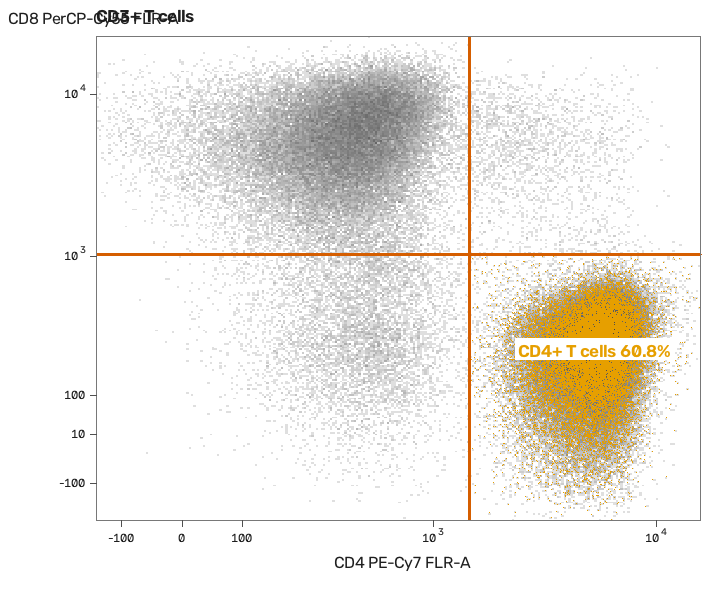
CD4+ T cells
CD4 against CD8 inside the T cells.
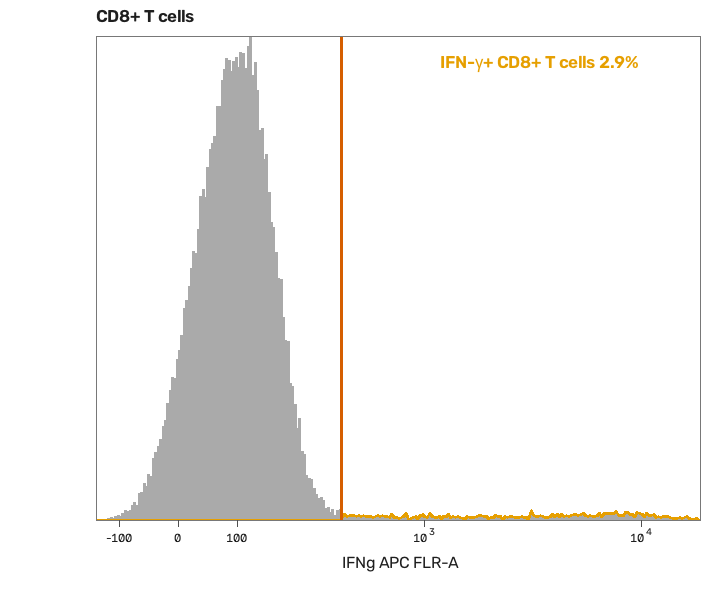
IFN-γ in CD8+ T cells
The cut set on the unstimulated well of the same donor.
What it flagged for a person to check
- Unstimulated background not read; response is raw
- IL-2 is a smear with no clear positive peak
- CD8 CD107a cut very high; true positives likely missed
One donor's stimulated well, 8-colour intracellular cytokine stain. Data: FlowKit (Scott White), BSD 3-Clause.
What you can ask for
Ask for these, or anything else you can see.
In plain words. If it can be seen on the sample, the AI can build a method to measure it.
- Percent CAR+ among CD4 and CD8 T cells
- Exhaustion markers such as PD-1, TIM-3, LAG-3, TIGIT and CD39
- Memory subsets from CCR7 and CD45RA
- Intracellular cytokines after stimulation
- T cells, B cells, plasma cells and macrophages named on multiplex slides
How it works
You upload, and we run the study.
01
Upload your slides or flow files
Any stain or panel. One sample is enough to start.
02
Say what to measure
In plain words, the way you would ask a colleague.
03
We run the study
The AI builds the method on one sample. A person checks it and locks it, and code measures every sample with it.
04
Get the report
Numbers, outlines, gates and flags for every sample. You pay for each slide or flow file.
Why VSQRD
- Every reported number measured by code, never by eye
- First-hand research and wet-lab perspective
- Direct founder involvement from discovery to rollout
Start with one study you have already reported.
Upload its samples and tell us what you measured. We run it and show you where our numbers and yours differ.
Book a Discovery Session